Review of Maritime Transport 2010 - Unctad
Review of Maritime Transport 2010 - Unctad
Review of Maritime Transport 2010 - Unctad
You also want an ePaper? Increase the reach of your titles
YUMPU automatically turns print PDFs into web optimized ePapers that Google loves.
vi<br />
<strong>Review</strong> <strong>of</strong> MARitiMe tRANspoRt <strong>2010</strong><br />
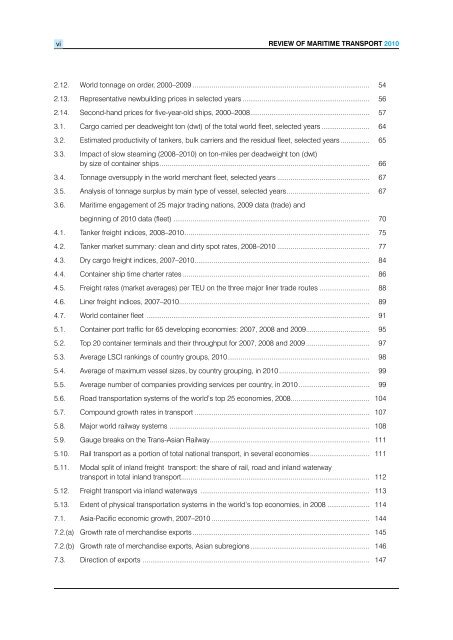
2.12. World tonnage on order, 2000–2009 ............................................................................................ 54<br />
2.13. Representative newbuilding prices in selected years .................................................................. 56<br />
2.14. Second‑hand prices for five‑year‑old ships, 2000–2008 .............................................................. 57<br />
3.1. Cargo carried per deadweight ton (dwt) <strong>of</strong> the total world fleet, selected years ......................... 64<br />
3.2. Estimated productivity <strong>of</strong> tankers, bulk carriers and the residual fleet, selected years ............... 65<br />
3.3. Impact <strong>of</strong> slow steaming (2008–<strong>2010</strong>) on ton‑miles per deadweight ton (dwt)<br />
by size <strong>of</strong> container ships ............................................................................................................. 66<br />
3.4. Tonnage oversupply in the world merchant fleet, selected years ................................................ 67<br />
3.5. Analysis <strong>of</strong> tonnage surplus by main type <strong>of</strong> vessel, selected years ........................................... 67<br />
3.6. <strong>Maritime</strong> engagement <strong>of</strong> 25 major trading nations, 2009 data (trade) and<br />
beginning <strong>of</strong> <strong>2010</strong> data (fleet) ...................................................................................................... 70<br />
4.1. Tanker freight indices, 2008–<strong>2010</strong> ................................................................................................ 75<br />
4.2. Tanker market summary: clean and dirty spot rates, 2008–<strong>2010</strong> ................................................ 77<br />
4.3. Dry cargo freight indices, 2007–<strong>2010</strong> ........................................................................................... 84<br />
4.4. Container ship time charter rates ................................................................................................. 86<br />
4.5. Freight rates (market averages) per TEU on the three major liner trade routes .......................... 88<br />
4.6. Liner freight indices, 2007–<strong>2010</strong> ................................................................................................... 89<br />
4.7. World container fleet .................................................................................................................... 91<br />
5.1. Container port traffic for 65 developing economies: 2007, 2008 and 2009 ................................. 95<br />
5.2. Top 20 container terminals and their throughput for 2007, 2008 and 2009 ................................. 97<br />
5.3. Average LSCI rankings <strong>of</strong> country groups, <strong>2010</strong> .......................................................................... 98<br />
5.4. Average <strong>of</strong> maximum vessel sizes, by country grouping, in <strong>2010</strong> ............................................... 99<br />
5.5. Average number <strong>of</strong> companies providing services per country, in <strong>2010</strong> ..................................... 99<br />
5.6. Road transportation systems <strong>of</strong> the world’s top 25 economies, 2008 ......................................... 104<br />
5.7. Compound growth rates in transport ........................................................................................... 107<br />
5.8. Major world railway systems ........................................................................................................ 108<br />
5.9. Gauge breaks on the Trans‑Asian Railway ................................................................................... 111<br />
5.10. Rail transport as a portion <strong>of</strong> total national transport, in several economies ............................... 111<br />
5.11. Modal split <strong>of</strong> inland freight transport: the share <strong>of</strong> rail, road and inland waterway<br />
transport in total inland transport .................................................................................................. 112<br />
5.12. Freight transport via inland waterways ........................................................................................ 113<br />
5.13. Extent <strong>of</strong> physical transportation systems in the world’s top economies, in 2008 ...................... 114<br />
7.1. Asia‑Pacific economic growth, 2007–<strong>2010</strong> .................................................................................. 144<br />
7.2.(a) Growth rate <strong>of</strong> merchandise exports ............................................................................................ 145<br />
7.2.(b) Growth rate <strong>of</strong> merchandise exports, Asian subregions .............................................................. 146<br />
7.3. Direction <strong>of</strong> exports ...................................................................................................................... 147


