

Review of Maritime Transport 2010 - Unctad
Review of Maritime Transport 2010 - Unctad
Review of Maritime Transport 2010 - Unctad

You also want an ePaper? Increase the reach of your titles
YUMPU automatically turns print PDFs into web optimized ePapers that Google loves.
150<br />
busiest seaports<br />
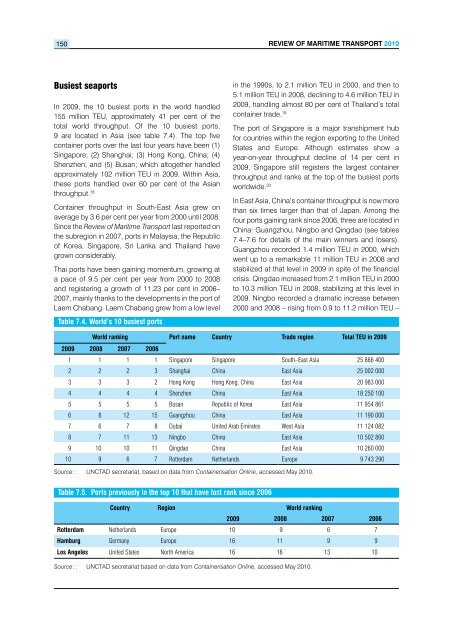
In 2009, the 10 busiest ports in the world handled<br />
155 million TEU, approximately 41 per cent <strong>of</strong> the<br />
total world throughput. Of the 10 busiest ports,<br />
9 are located in Asia (see table 7.4). The top five<br />
container ports over the last four years have been (1)<br />
Singapore; (2) Shanghai; (3) Hong Kong, China; (4)<br />
Shenzhen; and (5) Busan; which altogether handled<br />
approximately 102 million TEU in 2009. Within Asia,<br />
these ports handled over 60 per cent <strong>of</strong> the Asian<br />
throughput. 18<br />
Container throughput in South-East Asia grew on<br />
average by 3.6 per cent per year from 2000 until 2008.<br />
Since the <strong>Review</strong> <strong>of</strong> <strong>Maritime</strong> <strong>Transport</strong> last reported on<br />
the subregion in 2007, ports in Malaysia, the Republic<br />
<strong>of</strong> Korea, Singapore, Sri Lanka and Thailand have<br />
grown considerably.<br />
Thai ports have been gaining momentum, growing at<br />
a pace <strong>of</strong> 9.5 per cent per year from 2000 to 2008<br />
and registering a growth <strong>of</strong> 11.23 per cent in 2006–<br />
2007, mainly thanks to the developments in the port <strong>of</strong><br />
Laem Chabang. Laem Chabang grew from a low level<br />
Table 7.4. World’s 10 busiest ports<br />
<strong>Review</strong> <strong>of</strong> MaRitiMe tRanspoRt <strong>2010</strong><br />
in the 1990s, to 2.1 million TEU in 2000, and then to<br />
5.1 million TEU in 2008, declining to 4.6 million TEU in<br />
2009, handling almost 80 per cent <strong>of</strong> Thailand’s total<br />
container trade. 19<br />
The port <strong>of</strong> Singapore is a major transhipment hub<br />
for countries within the region exporting to the United<br />
States and Europe. Although estimates show a<br />
year-on-year throughput decline <strong>of</strong> 14 per cent in<br />
2009, Singapore still registers the largest container<br />
throughput and ranks at the top <strong>of</strong> the busiest ports<br />
worldwide. 20<br />
In East Asia, China’s container throughput is now more<br />
than six times larger than that <strong>of</strong> Japan. Among the<br />
four ports gaining rank since 2006, three are located in<br />
China: Guangzhou, Ningbo and Qingdao (see tables<br />
7.4–7.6 for details <strong>of</strong> the main winners and losers).<br />
Guangzhou recorded 1.4 million TEU in 2000, which<br />
went up to a remarkable 11 million TEU in 2008 and<br />
stabilized at that level in 2009 in spite <strong>of</strong> the financial<br />
crisis. Qingdao increased from 2.1 million TEU in 2000<br />
to 10.3 million TEU in 2008, stabilizing at this level in<br />
2009. Ningbo recorded a dramatic increase between<br />
2000 and 2008 – rising from 0.9 to 11.2 million TEU –<br />
World ranking Port name Country Trade region Total TEU in 2009<br />
2009 2008 2007 2006<br />
1 1 1 1 Singapore Singapore South–East Asia 25 866 400<br />
2 2 2 3 Shanghai China East Asia 25 002 000<br />
3 3 3 2 Hong Kong Hong Kong, China East Asia 20 983 000<br />
4 4 4 4 Shenzhen China East Asia 18 250 100<br />
5 5 5 5 Busan Republic <strong>of</strong> Korea East Asia 11 954 861<br />
6 8 12 15 Guangzhou China East Asia 11 190 000<br />
7 6 7 8 Dubai United Arab Emirates West Asia 11 124 082<br />
8 7 11 13 Ningbo China East Asia 10 502 800<br />
9 10 10 11 Qingdao China East Asia 10 260 000<br />
10 9 6 7 Rotterdam Netherlands Europe 9 743 290<br />
Source: : UNCTAD secretariat, based on data from Containerisation Online, accessed May <strong>2010</strong>.<br />
Table 7.5. Ports previously in the top 10 that have lost rank since 2006<br />
Country Region World ranking<br />
2009 2008 2007 2006<br />
Rotterdam Netherlands Europe 10 9 6 7<br />
Hamburg Germany Europe 16 11 9 9<br />
Los Angeles United States North America 16 16 13 10<br />
Source: : UNCTAD secretariat based on data from Containerisation Online, accessed May <strong>2010</strong>.


