

Review of Maritime Transport 2010 - Unctad
Review of Maritime Transport 2010 - Unctad
Review of Maritime Transport 2010 - Unctad

Create successful ePaper yourself
Turn your PDF publications into a flip-book with our unique Google optimized e-Paper software.
18<br />
goods are mainly carried by container, and as major<br />
importers, namely the United States and Europe, were<br />
badly hit by the recession, container trade received<br />
a major blow. Container traffic along the three major<br />
east–west container trade routes, namely the trans-<br />
Pacific, Asia–Europe, and the trans-Atlantic, was the<br />
most significantly affected, with volumes recording<br />
double-digit declines on some <strong>of</strong> the major legs (table<br />
1.5 and fig. 1.6)<br />
In 2009, aggregate Asia–Europe volumes declined by<br />
9.5 per cent, with the head haul segment from Asia to<br />
Europe contracting by 14.8 per cent. This contrasts<br />
significantly with the impressive annual growth rate <strong>of</strong><br />
about 20.0 per cent recorded previously. Trade on the<br />
trans–Pacific route fell by 9.3 per cent, with peak leg<br />
volumes declining by 14.2 per cent. Trade between<br />
the United States and Europe slumped by 20.1 per<br />
cent, with volumes from the United States to Europe<br />
falling by 25.1 per cent. The transatlantic trade was<br />
badly hit by the combined effect <strong>of</strong> declining volumes,<br />
unsustainably low freight rates, and rising bunker<br />
costs. Other container trades have also contracted,<br />
albeit at a less dramatic rate than the three major trade<br />
<strong>Review</strong> <strong>of</strong> MaRitiMe tRanspoRt <strong>2010</strong><br />
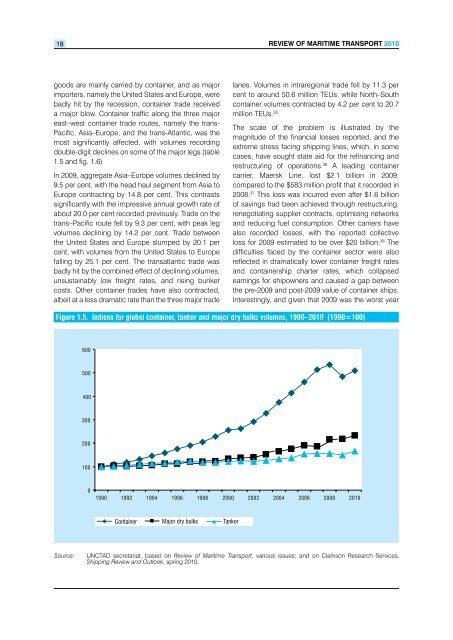
Figure 1.5. Indices for global container, tanker and major dry bulks volumes, 1990–<strong>2010</strong> (1990=100)<br />
600<br />
500<br />
400<br />
300<br />
200<br />
100<br />
0<br />
1990 1992 1994 1996 1998 2000 2002 2004 2006 2008 <strong>2010</strong><br />
Container Major dry bulks Tanker<br />
lanes. Volumes in intraregional trade fell by 11.3 per<br />
cent to around 50.6 million TEUs, while North–South<br />
container volumes contracted by 4.2 per cent to 20.7<br />
million TEUs. 35<br />
The scale <strong>of</strong> the problem is illustrated by the<br />
magnitude <strong>of</strong> the financial losses reported, and the<br />
extreme stress facing shipping lines, which, in some<br />
cases, have sought state aid for the refinancing and<br />
restructuring <strong>of</strong> operations. 36 A leading container<br />
carrier, Maersk Line, lost $2.1 billion in 2009,<br />
compared to the $583 million pr<strong>of</strong>it that it recorded in<br />
2008. 37 This loss was incurred even after $1.6 billion<br />
<strong>of</strong> savings had been achieved through restructuring,<br />
renegotiating supplier contracts, optimizing networks<br />
and reducing fuel consumption. Other carriers have<br />
also recorded losses, with the reported collective<br />
loss for 2009 estimated to be over $20 billion. 38 The<br />
difficulties faced by the container sector were also<br />
reflected in dramatically lower container freight rates<br />
and containership charter rates, which collapsed<br />
earnings for shipowners and caused a gap between<br />
the pre-2009 and post-2009 value <strong>of</strong> container ships.<br />
Interestingly, and given that 2009 was the worst year<br />
Source: UNCTAD secretariat, based on <strong>Review</strong> <strong>of</strong> <strong>Maritime</strong> <strong>Transport</strong>, various issues; and on Clarkson Research Services,<br />
Shipping <strong>Review</strong> and Outlook, spring <strong>2010</strong>.


