

Review of Maritime Transport 2010 - Unctad
Review of Maritime Transport 2010 - Unctad
Review of Maritime Transport 2010 - Unctad

Create successful ePaper yourself
Turn your PDF publications into a flip-book with our unique Google optimized e-Paper software.
CHapteR 5: poRt and MultiModal tRanspoRt developMents 97<br />
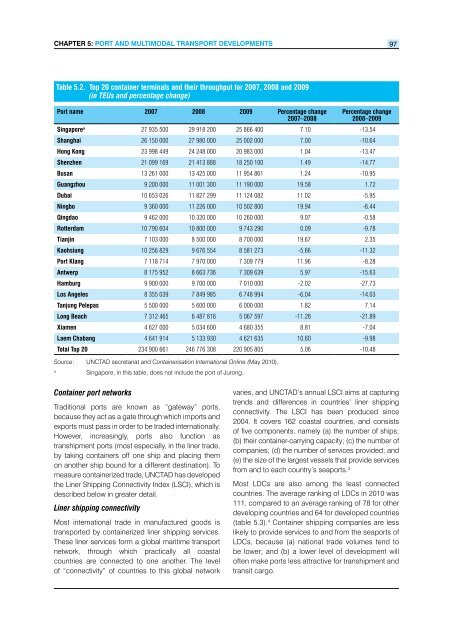
Table 5.2. Top 20 container terminals and their throughput for 2007, 2008 and 2009<br />
(in TEUs and percentage change)<br />
Port name 2007 2008 2009 Percentage change<br />
2007–2008<br />
Percentage change<br />
2008–2009<br />
Singapore a 27 935 500 29 918 200 25 866 400 7.10 -13.54<br />
Shanghai 26 150 000 27 980 000 25 002 000 7.00 -10.64<br />
Hong Kong 23 998 449 24 248 000 20 983 000 1.04 -13.47<br />
Shenzhen 21 099 169 21 413 888 18 250 100 1.49 -14.77<br />
Busan 13 261 000 13 425 000 11 954 861 1.24 -10.95<br />
Guangzhou 9 200 000 11 001 300 11 190 000 19.58 1.72<br />
Dubai 10 653 026 11 827 299 11 124 082 11.02 -5.95<br />
Ningbo 9 360 000 11 226 000 10 502 800 19.94 -6.44<br />
Qingdao 9 462 000 10 320 000 10 260 000 9.07 -0.58<br />
Rotterdam 10 790 604 10 800 000 9 743 290 0.09 -9.78<br />
Tianjin 7 103 000 8 500 000 8 700 000 19.67 2.35<br />
Kaohsiung 10 256 829 9 676 554 8 581 273 -5.66 -11.32<br />
Port Klang 7 118 714 7 970 000 7 309 779 11.96 -8.28<br />
Antwerp 8 175 952 8 663 736 7 309 639 5.97 -15.63<br />
Hamburg 9 900 000 9 700 000 7 010 000 -2.02 -27.73<br />
Los Angeles 8 355 039 7 849 985 6 748 994 -6.04 -14.03<br />
Tanjung Pelepas 5 500 000 5 600 000 6 000 000 1.82 7.14<br />
Long Beach 7 312 465 6 487 816 5 067 597 -11.28 -21.89<br />
Xiamen 4 627 000 5 034 600 4 680 355 8.81 -7.04<br />
Laem Chabang 4 641 914 5 133 930 4 621 635 10.60 -9.98<br />
Total Top 20 234 900 661 246 776 308 220 905 805 5.06 -10.48<br />
Source: UNCTAD secretariat and Containerisation International Online (May <strong>2010</strong>).<br />
a Singapore, in this table, does not include the port <strong>of</strong> Jurong.<br />
Container port networks<br />
Traditional ports are known as “gateway” ports,<br />
because they act as a gate through which imports and<br />
exports must pass in order to be traded internationally.<br />
However, increasingly, ports also function as<br />
transhipment ports (most especially, in the liner trade,<br />
by taking containers <strong>of</strong>f one ship and placing them<br />
on another ship bound for a different destination). To<br />
measure containerized trade, UNCTAD has developed<br />
the Liner Shipping Connectivity Index (LSCI), which is<br />
described below in greater detail.<br />
Liner shipping connectivity<br />
Most international trade in manufactured goods is<br />
transported by containerized liner shipping services.<br />
These liner services form a global maritime transport<br />
network, through which practically all coastal<br />
countries are connected to one another. The level<br />
<strong>of</strong> “connectivity” <strong>of</strong> countries to this global network<br />
varies, and UNCTAD’s annual LSCI aims at capturing<br />
trends and differences in countries’ liner shipping<br />
connectivity. The LSCI has been produced since<br />
2004. It covers 162 coastal countries, and consists<br />
<strong>of</strong> five components, namely (a) the number <strong>of</strong> ships;<br />
(b) their container-carrying capacity; (c) the number <strong>of</strong><br />
companies; (d) the number <strong>of</strong> services provided; and<br />
(e) the size <strong>of</strong> the largest vessels that provide services<br />
from and to each country’s seaports. 3<br />
Most LDCs are also among the least connected<br />
countries. The average ranking <strong>of</strong> LDCs in <strong>2010</strong> was<br />
111, compared to an average ranking <strong>of</strong> 78 for other<br />
developing countries and 64 for developed countries<br />
(table 5.3). 4 Container shipping companies are less<br />
likely to provide services to and from the seaports <strong>of</strong><br />
LDCs, because (a) national trade volumes tend to<br />
be lower; and (b) a lower level <strong>of</strong> development will<br />
<strong>of</strong>ten make ports less attractive for transhipment and<br />
transit cargo.


