SLSNZ NATIONAL Beach & Coastal Safety Report
New Zealand has one of the highest fatal drowning rates in the OECD1. This report is our way of drawing a line in the sand. We, Surf Life Saving New Zealand, are saying “enough is enough”. No more unnecessary deaths from drowning on our beaches and along our coastline.
New Zealand has one of the highest fatal drowning rates in the OECD1. This report is our way of drawing a line in the sand. We, Surf Life Saving New Zealand, are saying “enough is enough”. No more unnecessary deaths from drowning on our beaches and along our coastline.

Create successful ePaper yourself
Turn your PDF publications into a flip-book with our unique Google optimized e-Paper software.
MANAWATU-WANGANUI<br />
FATAL DROWNING SNAPSHOT<br />
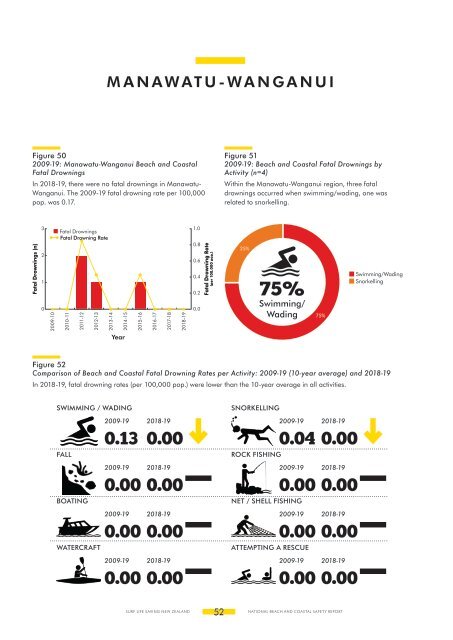
Figure 50<br />
2009-19: Manawatu-Wanganui <strong>Beach</strong> and <strong>Coastal</strong><br />
Fatal Drownings<br />
In 2018-19, there were no fatal drownings in Manawatu-<br />
Wanganui. The 2009-19 fatal drowning rate per 100,000<br />
pop. was 0.17.<br />
Fatal Drownings (n)<br />
3<br />
2<br />
1<br />
0<br />
2009-10<br />
Fatal Drownings<br />
Fatal Drowning Rate<br />
2010-11<br />
Figure 51<br />
2009-19: <strong>Beach</strong> and <strong>Coastal</strong> Fatal Drownings by<br />
Activity (n=4)<br />
Within the Manawatu-Wanganui region, three fatal<br />
drownings occurred when swimming/wading, one was<br />
related to snorkelling.<br />
Figure 52<br />
Comparison of <strong>Beach</strong> and <strong>Coastal</strong> Fatal Drowning Rates per Activity: 2009-19 (10-year average) and 2018-19<br />
In 2018-19, fatal drowning rates (per 100,000 pop.) were lower than the 10-year average in all activities.<br />
SWIMMING / WADING<br />
FALL<br />
2011-12<br />
BOATING<br />
2012-13<br />
WATERCRAFT<br />
2013-14<br />
2014-15<br />
Year<br />
2009-19<br />
0.13<br />
2015-16<br />
2009-19<br />
0.00<br />
2009-19<br />
0.00<br />
2009-19<br />
0.00<br />
2016-17<br />
2017-18<br />
2018-19<br />
2018-19<br />
0.00<br />
2018-19<br />
0.00<br />
2018-19<br />
0.00<br />
2018-19<br />
0.00<br />
1.0<br />
0.8<br />
0.6<br />
0.4<br />
0.2<br />
0.0<br />
Fatal Drowning Rate<br />
(per 100,000 pop.)<br />
25%<br />
SNORKELLING<br />
ROCK FISHING<br />
75%<br />
2009-19<br />
0.04<br />
2009-19<br />
0.00<br />
NET / SHELL FISHING<br />
2009-19<br />
0.00<br />
ATTEMPTING A RESCUE<br />
2009-19<br />
0.00<br />
75%<br />
2018-19<br />
0.00<br />
2018-19<br />
0.00<br />
2018-19<br />
0.00<br />
2018-19<br />
0.00<br />
Swimming/Wading<br />
Snorkelling<br />
10-YEAR OVERVIEW | 2009-19 1-YEAR OVERVIEW | 2018-19<br />
Attempting a Rescue<br />
Boating<br />
Diving / Jumping<br />
Fall<br />
AVERAGE FATAL DROWNINGS<br />