Norrporten-2012-UK
Norrporten-2012-UK
Norrporten-2012-UK

Create successful ePaper yourself
Turn your PDF publications into a flip-book with our unique Google optimized e-Paper software.
Market areas – distribution by floor space and rental value<br />
Floor space Share of Rental value<br />
Market area 1 000 m2 total space, % EUR M<br />
Luleå 86.3 7.8 13.0<br />
Umeå 88.4 8.0 15.0<br />
Sundsvall 219.0 19.9 35.3<br />
Gävle 106.9 9.7 14.3<br />
Stockholm 83.0 7.5 24.6<br />
Örebro 74.1 6.7 12.7<br />
Jönköping 98.9 9.0 17.1<br />
Växjö 88.2 8.0 12.7<br />
Helsingborg 116.2 10.6 23.2<br />
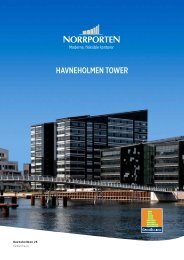
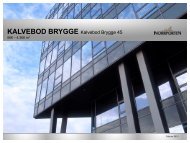
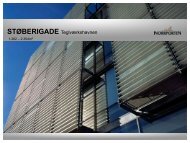
Copenhagen 109.1 9.9 33.4<br />
Hamburg 31.5 2.9 9.6<br />
Total 1 101.7 100.0 210.8<br />
Type of premises – distribution by floor space and rental value<br />
Floor space Share of Rental value<br />
Market area 1 000 m2 total space, % EUR M<br />
Office 915.5 83.1 175.2<br />
Retail 96.4 8.8 18.8<br />
Housing 29.0 2.6 3.0<br />
Other 60.9 5.5 13.8<br />
Total 1 101.7 100.0 210.8<br />
Tenant categories – distribution by floor space and rental value<br />
Floor space Share of Rental value<br />
Market area 1 000 m2 total space, % EUR M<br />
Government authorities<br />
Municipality/<br />
375.8 34.1 66.1<br />
county councils 27.2 2.5 5.1<br />
Banks/insurance 86.0 7.8 23.1<br />
Retail 90.3 8.2 17.9<br />
Housing 28.6 2.6 3.2<br />
Other office/retail 493.7 44.8 95.7<br />
Total 1 101.7 100.0 210.8<br />
deSCriPtioN of ProPerty Portfolio<br />
Copenhagen, 15.8<br />
Helsingborg, 11.0<br />
Växjö, 6.0<br />
Distribution by rental value, %<br />
Jönköping, 8.1<br />
Hamburg, 4.5<br />
Örebro, 6.0<br />
Luleå, 6.2<br />
Umeå, 7.1<br />
Sundsvall, 16.8<br />
Gävle, 6.8<br />
Stockholm, 11.7<br />
Distribution by rental value, %<br />
Housing, 1.4<br />
Retail, 8.9<br />
Other office/<br />
retail, 45.4<br />
Other, 6.6<br />
Housing, 1.5<br />
Retail, 8.4<br />
Type of premises and market areas – distribution by rental value, EUR M<br />
Office, 83.1<br />
Distribution by rental value, %<br />
Government<br />
authorities, 31.4<br />
Municipalities/<br />
county councils, 2.4<br />
Banks/<br />
insurance, 11.0<br />
Sunds- Stock- Jön- Helsing- Copen- Ham-<br />
Luleå Umeå vall Gävle holm Örebro köping Växjö borg hagen burg Total<br />
Office 7.2 9.3 27.7 12.6 23.4 10.5 15.5 10.3 17.7 32.4 8.5 175.2<br />
Retail 4.5 3.7 2.7 0.7 0.1 0.6 0.6 1.5 3.6 0.1 0.6 18.8<br />
Housing 0.7 0.4 0.8 0.2 0.0 – 0.0 0.2 0.6 – – 3.0<br />
Other 0.6 1.6 4.0 0.8 1.0 1.6 1.0 0.6 1.2 0.9 0.5 13.8<br />
Total 13.0 15.0 35.3 14.3 24.6 12.7 17.1 12.7 23.2 33.4 9.6 210.8<br />
Properties 11 16 39 12 3 7 6 8 15 7 3 127<br />
15