vgbe energy journal 5 (2022) - International Journal for Generation and Storage of Electricity and Heat
vgbe energy journal - International Journal for Generation and Storage of Electricity and Heat. Issue 5 (2022). Technical Journal of the vgbe energy e.V. - Energy is us! NOTICE: Please feel free to read this free copy of the vgbe energy journal. This is our temporary contribution to support experience exchange in the energy industry during Corona times. The printed edition, subscription as well as further services are available on our website, www.vgbe.energy +++++++++++++++++++++++++++++++++++++++++++++++++++++++ Christopher Weßelmann: Editorial Nuclear power in numbers 2021/2022 Kernenergie in Zahlen 2021/2022 Peter Schluppkothen and Mats-Milan L. Müller: How the digital project twin changes plant engineering in power industry Der Digital Project Twin revolutioniert den Anlagenbau in der Energiewirtschaft Stefan Loubichi: Cyberwar in the energy industry: The current status Cyberwar in der Energiewirtschaft: der aktuelle Stand Antonio Ballesteros Avila and Miguel Peinador Veira: Operating experience from ageing events occurred at nuclear power plants Betriebserfahrungen mit Ereignissen in Bezug auf die Betriebszeit von Kernkraftwerken Minhee Kim, Junkyu Song and Kyungho Nam: Assessment of loss of shutdown cooling system accident during mid-loop operation in LSTF experiment using SPACE Code Bewertung des Ausfalls des Nachkühlsystems während des Mitte-Loop-Betriebs im LSTF-Experiment unter Verwendung des SPACE-Codes Jürgen Knorr and Albert Kerber: TRIPLE C waste container for increased long-term safety of HHGW disposal in salt, clay and crystalline TRIPLE C Abfallbehälter zur Erhöhung der Langzeitsicherheit der Einlagerung radioaktiver Abfälle in Salz, Ton und Kristallin Editorial: Nuclear power plants worldwide: Compact statistic 2021 Kernkraftwerke weltweit: Schnellstatistik 2021 vgbe energy: Operating experience with nuclear power plants 2021 Betriebserfahrungen mit Kernkraftwerken 2021 Paul Baruya: Power and coal prospects in developing Africa Trends der Stromerzeugung und des Kohleeinsatzes in den Entwicklungsländern Afrikas
vgbe energy journal - International Journal for Generation and Storage of Electricity and Heat.
Issue 5 (2022).
Technical Journal of the vgbe energy e.V. - Energy is us!
NOTICE: Please feel free to read this free copy of the vgbe energy journal. This is our temporary contribution to support experience exchange in the energy industry during Corona times. The printed edition, subscription as well as further services are available on our website, www.vgbe.energy
+++++++++++++++++++++++++++++++++++++++++++++++++++++++
Christopher Weßelmann: Editorial
Nuclear power in numbers 2021/2022
Kernenergie in Zahlen 2021/2022
Peter Schluppkothen and Mats-Milan L. Müller:
How the digital project twin changes plant engineering in power industry
Der Digital Project Twin revolutioniert den Anlagenbau in der Energiewirtschaft
Stefan Loubichi:
Cyberwar in the energy industry: The current status
Cyberwar in der Energiewirtschaft: der aktuelle Stand
Antonio Ballesteros Avila and Miguel Peinador Veira:
Operating experience from ageing events occurred at nuclear power plants
Betriebserfahrungen mit Ereignissen in Bezug auf die Betriebszeit von Kernkraftwerken
Minhee Kim, Junkyu Song and Kyungho Nam:
Assessment of loss of shutdown cooling system accident during mid-loop operation in LSTF experiment using SPACE Code
Bewertung des Ausfalls des Nachkühlsystems während des Mitte-Loop-Betriebs im LSTF-Experiment unter Verwendung des SPACE-Codes
Jürgen Knorr and Albert Kerber:
TRIPLE C waste container for increased long-term safety of HHGW disposal in salt, clay and crystalline
TRIPLE C Abfallbehälter zur Erhöhung der Langzeitsicherheit der Einlagerung radioaktiver Abfälle in Salz, Ton und Kristallin
Editorial:
Nuclear power plants worldwide: Compact statistic 2021
Kernkraftwerke weltweit: Schnellstatistik 2021
vgbe energy:
Operating experience with nuclear power plants 2021
Betriebserfahrungen mit Kernkraftwerken 2021
Paul Baruya:
Power and coal prospects in developing Africa
Trends der Stromerzeugung und des Kohleeinsatzes in den Entwicklungsländern Afrikas

You also want an ePaper? Increase the reach of your titles
YUMPU automatically turns print PDFs into web optimized ePapers that Google loves.
Assessment <strong>of</strong> loss <strong>of</strong> shutdown cooling system accident using SPACE Code<br />
equivalent to 5 % <strong>of</strong> cold leg cross area, <strong>and</strong><br />
the opening are located at centerline <strong>of</strong> the<br />
cold legs. The steady-state results are established<br />
<strong>for</strong> conducting a null transient calculation.<br />
IV<br />
A<br />
Results <strong>and</strong> discussion<br />
Initial conditions<br />
In order to confirm the modeling methodology<br />
<strong>and</strong> input condition, the steady-state<br />
calculation result is compared with experimental<br />
data. The major parameters in<br />
steady-state condition are summarized in<br />
Ta b l e 1 . The core power was 430 kW with<br />
Tab. 1. Steady state calculation results.<br />
Parameters LSTF SPACE<br />
Core power (kW) 430 430.0<br />
Hot-leg temp.(K) 334 334.1<br />
Cold-leg temp.(K) 318 318.0<br />
Primary pressure (MPa) 0.1013 0.1013<br />
Water level at loops (m)<br />
- hot leg void<br />
- cold leg void<br />
Secondary pressure<br />
(MPa)<br />
Mid-loop<br />
Mid-loop<br />
- 0.55<br />
- 0.47<br />
0.1013 0.1013<br />
Secondary fluid temp. (K) 317 317.0<br />
Water level in SG (m) 10 10.2<br />
decay heat at about 20 hours after the reactor<br />
shut down. The water levels <strong>of</strong> hot <strong>and</strong><br />
cold legs maintain at the middle <strong>of</strong> the loop.<br />
Core power <strong>and</strong> loop temperature were set to<br />
target values <strong>for</strong> calculation. Initial conditions<br />
<strong>of</strong> loop water level represent the same<br />
value with target data. The pressurizer <strong>and</strong><br />
SGs relief valves were opened to maintain an<br />
atmospheric pressure. Overall results show<br />
that SPACE code have a reasonable agreement<br />
with target values in steady state analysis.<br />
The steady-state results are established<br />
<strong>for</strong> conducting a null transient calculation.<br />
B<br />
Transition behavior<br />
The transient calculation was initiated by<br />
decreasing the RHR pump flow rate from the<br />
initial value to zero during 20 seconds with<br />
opening the cold leg valve. The pressurizer<br />
<strong>and</strong> SGs relief valves were closed with cold<br />
leg opening.<br />
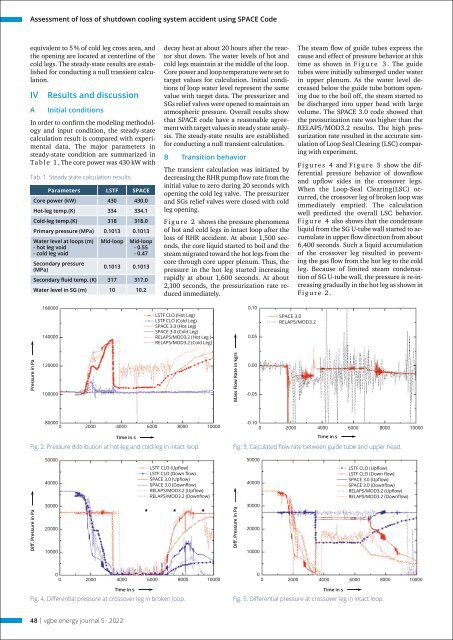
F i g u r e 2 shows the pressure phenomena<br />
<strong>of</strong> hot <strong>and</strong> cold legs in intact loop after the<br />
loss <strong>of</strong> RHR accident. At about 1,500 seconds,<br />
the core liquid started to boil <strong>and</strong> the<br />
steam migrated toward the hot legs from the<br />
core through core upper plenum. Thus, the<br />
pressure in the hot leg started increasing<br />
rapidly at about 1,600 seconds. At about<br />
2,100 seconds, the pressurization rate reduced<br />
immediately.<br />
The steam flow <strong>of</strong> guide tubes express the<br />
cause <strong>and</strong> effect <strong>of</strong> pressure behavior at this<br />
time as shown in F i g u r e 3 . The guide<br />
tubes were initially submerged under water<br />
in upper plenum. As the water level decreased<br />
below the guide tube bottom opening<br />
due to the boil <strong>of</strong>f, the steam started to<br />
be discharged into upper head with large<br />
volume. The SPACE 3.0 code showed that<br />
the pressurization rate was higher than the<br />
RELAP5/MOD3.2 results. The high pressurization<br />
rate resulted in the accurate simulation<br />
<strong>of</strong> Loop Seal Clearing (LSC) comparing<br />
with experiment.<br />
Figures 4 <strong>and</strong> Figure 5 show the differential<br />
pressure behavior <strong>of</strong> downflow<br />
<strong>and</strong> upflow sides in the crossover legs.<br />
When the Loop-Seal Clearing(LSC) occurred,<br />
the crossover leg <strong>of</strong> broken loop was<br />
immediately emptied. The calculation<br />
well predicted the overall LSC behavior.<br />
F i g u r e 4 also shows that the condensate<br />
liquid from the SG U-tube wall started to accumulate<br />
in upper flow direction from about<br />
6,400 seconds. Such a liquid accumulation<br />
<strong>of</strong> the crossover leg resulted in preventing<br />
the gas flow from the hot leg to the cold<br />
leg. Because <strong>of</strong> limited steam condensation<br />
<strong>of</strong> SG U-tube wall, the pressure is re-increasing<br />
gradually in the hot leg as shown in<br />
Figure 2.<br />
160000<br />
140000<br />
LSTF CLO (Hot Leg)<br />
LSTF CLO (Cold Leg)<br />
SPACE 3.0 (Hot Leg)<br />
SPACE 3.0 (Cold Leg)<br />
RELAP5/MOD3.2 (Hot Leg )<br />
RELAP5/MOD3.2 (Cold Leg)<br />
0.10<br />
0.05<br />
SPACE 3.0<br />
RELAP5/MOD3.2<br />
Pressure in Pa<br />
120000<br />
100000<br />
Mass Flow Rate in kg/s<br />
0.00<br />
-0.05<br />
80000<br />
0 2000 4000 6000 8000 10000<br />
Time in s<br />
Fig. 2. Pressure distribution at hot-leg <strong>and</strong> cold-leg in intact loop.<br />
-0.10<br />
0 2000 4000 6000 8000 10000<br />
Time in s<br />
Fig. 3. Calculated flow rate between guide tube <strong>and</strong> upper head.<br />
50000<br />
50000<br />
40000<br />
LSTF CLO (Upflow)<br />
LSTF CLO (Down flow)<br />
SPACE 3.0 (Upflow)<br />
SPACE 3.0 (Downflow)<br />
RELAPS/MOD3.2 (Upflow)<br />
RELAPS/MOD3.2 (Downflow)<br />
40000<br />
LSTF CLO (Upflow)<br />
LSTF CLO (Down flow)<br />
SPACE 3.0 (Upflow)<br />
SPACE 3.0 (Downflow)<br />
RELAPS/MOD3.2 (Upflow)<br />
RELAPS/MOD3.2 (Downflow)<br />
Diff. Pressure in Pa<br />
30000<br />
20000<br />
10000<br />
Diff. Pressure in Pa<br />
30000<br />
20000<br />
10000<br />
0<br />
0 2000 4000 6000 8000 10000<br />
Time in s<br />
Fig. 4. Differential pressure at crossover leg in broken loop.<br />
0<br />
0 2000 4000 6000 8000 10000<br />
Time in s<br />
Fig. 5. Differential pressure at crossover leg in intact loop.<br />
48 | <strong>vgbe</strong> <strong>energy</strong> <strong>journal</strong> 5 · <strong>2022</strong>