Coach and Athlete Burnout - West Virginia University
Coach and Athlete Burnout - West Virginia University
Coach and Athlete Burnout - West Virginia University
You also want an ePaper? Increase the reach of your titles
YUMPU automatically turns print PDFs into web optimized ePapers that Google loves.
<strong>Burnout</strong> 16<br />
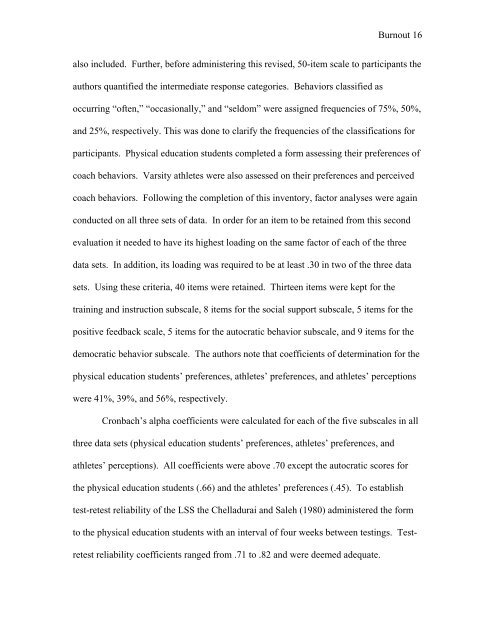
also included. Further, before administering this revised, 50-item scale to participants the<br />
authors quantified the intermediate response categories. Behaviors classified as<br />
occurring “often,” “occasionally,” <strong>and</strong> “seldom” were assigned frequencies of 75%, 50%,<br />
<strong>and</strong> 25%, respectively. This was done to clarify the frequencies of the classifications for<br />
participants. Physical education students completed a form assessing their preferences of<br />
coach behaviors. Varsity athletes were also assessed on their preferences <strong>and</strong> perceived<br />
coach behaviors. Following the completion of this inventory, factor analyses were again<br />
conducted on all three sets of data. In order for an item to be retained from this second<br />
evaluation it needed to have its highest loading on the same factor of each of the three<br />
data sets. In addition, its loading was required to be at least .30 in two of the three data<br />
sets. Using these criteria, 40 items were retained. Thirteen items were kept for the<br />
training <strong>and</strong> instruction subscale, 8 items for the social support subscale, 5 items for the<br />
positive feedback scale, 5 items for the autocratic behavior subscale, <strong>and</strong> 9 items for the<br />
democratic behavior subscale. The authors note that coefficients of determination for the<br />
physical education students’ preferences, athletes’ preferences, <strong>and</strong> athletes’ perceptions<br />
were 41%, 39%, <strong>and</strong> 56%, respectively.<br />
Cronbach’s alpha coefficients were calculated for each of the five subscales in all<br />
three data sets (physical education students’ preferences, athletes’ preferences, <strong>and</strong><br />
athletes’ perceptions). All coefficients were above .70 except the autocratic scores for<br />
the physical education students (.66) <strong>and</strong> the athletes’ preferences (.45). To establish<br />
test-retest reliability of the LSS the Chelladurai <strong>and</strong> Saleh (1980) administered the form<br />
to the physical education students with an interval of four weeks between testings. Test-<br />
retest reliability coefficients ranged from .71 to .82 <strong>and</strong> were deemed adequate.


