Brazilian Journal of Analytical Chemistry - BRJAC - Brazilian Journal ...
Brazilian Journal of Analytical Chemistry - BRJAC - Brazilian Journal ...
Brazilian Journal of Analytical Chemistry - BRJAC - Brazilian Journal ...

Create successful ePaper yourself
Turn your PDF publications into a flip-book with our unique Google optimized e-Paper software.
ma samples in three cycles was studied with control<br />
concentrations in quintuplicate. Samples were frozen<br />
at - 20°C and thawed in three cycles <strong>of</strong> 24, 36 and<br />
48 h. In addition, the long-term stability <strong>of</strong> FLU in QC<br />
samples was also evaluated by analysis after 134 days<br />
<strong>of</strong> storage at - 20°C. Autosampler stability was studied<br />
over a 12-24 h storage period in the autosampler rack<br />
with control concentrations.<br />
rEsults<br />
sElECtivity<br />
The analysis <strong>of</strong> flunarizine and cinarizine using the selective<br />
reaction monitoring (SRM) function was highly<br />
selective, with neither interfering compounds nor significant<br />
ion supression from endogenous substances<br />
observed at the retention times for flunarizine and IS,<br />
as shown in Figure 2.<br />
fi g u rE 2. rEPrEsEntativE srm C h ro m a t o g ra m s o f f l u n a r i z i nE a n d CinarizinE<br />
in B l a n k human P l a s m a.<br />
Figure 3 shows the mass spectrum <strong>of</strong> FLU in the sequential<br />
mode: m/z 404.60 generating ion fragments<br />
at m/z 202.90 at collision energies <strong>of</strong> 20 eV. The intensities<br />
<strong>of</strong> other fragments are negligible.<br />
fi g u rE 3. ms-ms sPECtra o f f l u n a r i z i nE BasE PEak at m/z 404.6 a n d<br />
daugthEr PEak m/z 202.9. Co l l i s i o n E n E rg y 20Ev.<br />
www.brjac.com.br<br />
determination o f f l u n a r i z i n e in plasma by liquid<br />
C h ro m a t o g r a p h y-eleCtrospray t a n d e m m a s s speCtrometry.<br />
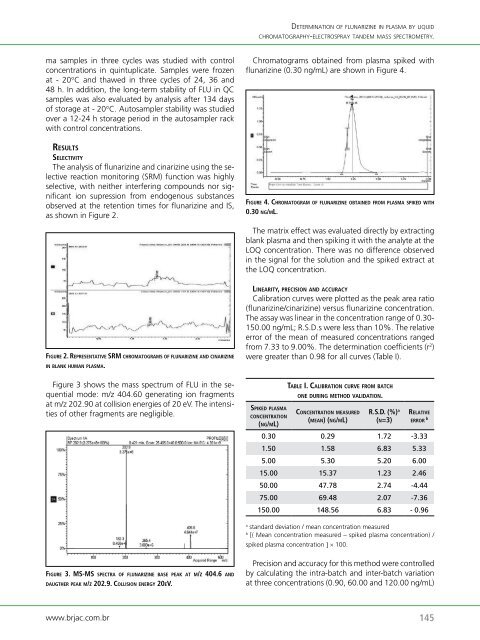
Chromatograms obtained from plasma spiked with<br />
flunarizine (0.30 ng/mL) are shown in Figure 4.<br />
fi g u rE 4. Ch ro m a t o g ra m o f f l u n a r i z i nE o B t a i nE d f ro m P l a s m a sPikEd w i t h<br />
0.30 n g/ml.<br />
The matrix effect was evaluated directly by extracting<br />
blank plasma and then spiking it with the analyte at the<br />
LOQ concentration. There was no difference observed<br />
in the signal for the solution and the spiked extract at<br />
the LOQ concentration.<br />
linEarity, PrECision a n d a C C u ra C y<br />
Calibration curves were plotted as the peak area ratio<br />
(flunarizine/cinarizine) versus flunarizine concentration.<br />
The assay was linear in the concentration range <strong>of</strong> 0.30-<br />
150.00 ng/mL; R.S.D.s were less than 10%. The relative<br />
error <strong>of</strong> the mean <strong>of</strong> measured concentrations ranged<br />
from 7.33 to 9.00%. The determination coefficients (r 2 )<br />
were greater than 0.98 for all curves (Table I).<br />
sP i kE d P l a s m a<br />
C o n C E n t r a t i o n<br />
(n g/ml)<br />
taBlE i. CaliBration CurvE f ro m BatCh<br />
o n E d u r i n g m E t h o d validation.<br />
Co n C E n t r a t i o n mEasurEd<br />
(m E a n) (n g/ml)<br />
r.s.d. (%) a<br />
(n=3)<br />
rE l a t i v E<br />
E r ro r b<br />
0.30 0.29 1.72 -3.33<br />
1.50 1.58 6.83 5.33<br />
5.00 5.30 5.20 6.00<br />
15.00 15.37 1.23 2.46<br />
50.00 47.78 2.74 -4.44<br />
75.00 69.48 2.07 -7.36<br />
150.00 148.56 6.83 - 0.96<br />
a standard deviation / mean concentration measured<br />
b [( Mean concentration measured – spiked plasma concentration) /<br />
spiked plasma concentration ] × 100.<br />
Precision and accuracy for this method were controlled<br />
by calculating the intra-batch and inter-batch variation<br />
at three concentrations (0.90, 60.00 and 120.00 ng/mL)<br />
145