Brazilian Journal of Analytical Chemistry - BRJAC - Brazilian Journal ...
Brazilian Journal of Analytical Chemistry - BRJAC - Brazilian Journal ...
Brazilian Journal of Analytical Chemistry - BRJAC - Brazilian Journal ...

Create successful ePaper yourself
Turn your PDF publications into a flip-book with our unique Google optimized e-Paper software.
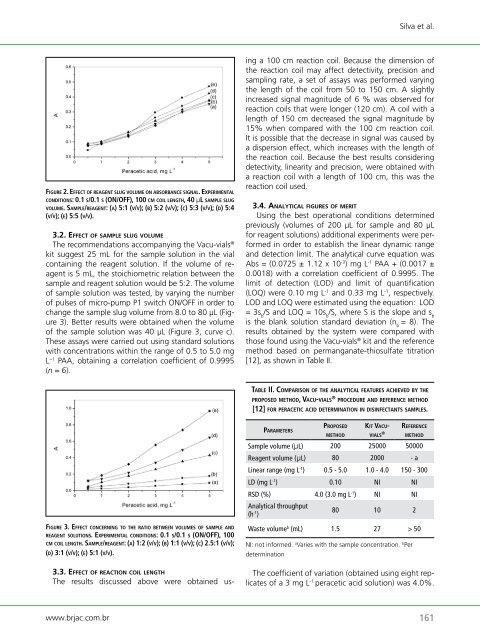
fi g u rE 2. EffECt o f rE a g E n t slug v o l u m E o n aBsorBanCE s i g n a l. ExPErimEntal<br />
C o n d i t i o n s: 0.1 s/0.1 s (on/<strong>of</strong>f), 100 Cm C o i l l E n g t h, 40 μl s a m P l E slug<br />
v o l u m E. sa m P l E/rE a g E n t: (a) 5:1 (v/v); (B) 5:2 (v/v); (C) 5:3 (v/v); (d) 5:4<br />
(v/v); (E) 5:5 (v/v).<br />
3.2. eff e c t o f sample s l u g v o l u m e<br />
The recommendations accompanying the Vacu-vials ®<br />
kit suggest 25 mL for the sample solution in the vial<br />
containing the reagent solution. If the volume <strong>of</strong> reagent<br />
is 5 mL, the stoichiometric relation between the<br />
sample and reagent solution would be 5:2. The volume<br />
<strong>of</strong> sample solution was tested, by varying the number<br />
<strong>of</strong> pulses <strong>of</strong> micro-pump P1 switch ON/OFF in order to<br />
change the sample slug volume from 8.0 to 80 µL (Figure<br />
3). Better results were obtained when the volume<br />
<strong>of</strong> the sample solution was 40 µL (Figure 3, curve c).<br />
These assays were carried out using standard solutions<br />
with concentrations within the range <strong>of</strong> 0.5 to 5.0 mg<br />
L −1 PAA, obtaining a correlation coefficient <strong>of</strong> 0.9995<br />
(n = 6).<br />
fi g u rE 3. EffECt C o n C E r n i n g to thE ratio BEtwEEn v o l u m E s o f s a m P l E a n d<br />
rE a g E n t s o l u t i o n s. ExPErimEntal C o n d i t i o n s: 0.1 s/0.1 s (on/<strong>of</strong>f), 100<br />
Cm C o i l l E n g t h. sa m P l E/rE a g E n t: (a) 1:2 (v/v); (B) 1:1 (v/v); (C) 2.5:1 (v/v);<br />
(d) 3:1 (v/v); (E) 5:1 (v/v).<br />
3.3. eff e c t o f reactIon c o Il l e n g t h<br />
The results discussed above were obtained us-<br />
www.brjac.com.br<br />
ing a 100 cm reaction coil. Because the dimension <strong>of</strong><br />
the reaction coil may affect detectivity, precision and<br />
sampling rate, a set <strong>of</strong> assays was performed varying<br />
the length <strong>of</strong> the coil from 50 to 150 cm. A slightly<br />
increased signal magnitude <strong>of</strong> 6 % was observed for<br />
reaction coils that were longer (120 cm). A coil with a<br />
length <strong>of</strong> 150 cm decreased the signal magnitude by<br />
15% when compared with the 100 cm reaction coil.<br />
It is possible that the decrease in signal was caused by<br />
a dispersion effect, which increases with the length <strong>of</strong><br />
the reaction coil. Because the best results considering<br />
detectivity, linearity and precision, were obtained with<br />
a reaction coil with a length <strong>of</strong> 100 cm, this was the<br />
reaction coil used.<br />
3.4. an a l y t Ic a l f Ig u r e s o f m e r It<br />
Using the best operational conditions determined<br />
previously (volumes <strong>of</strong> 200 μL for sample and 80 μL<br />
for reagent solutions) additional experiments were performed<br />
in order to establish the linear dynamic range<br />
and detection limit. The analytical curve equation was<br />
Abs = (0.0725 ± 1.12 x 10 -3 ) mg L -1 PAA + (0.0017 ±<br />
0.0018) with a correlation coefficient <strong>of</strong> 0.9995. The<br />
limit <strong>of</strong> detection (LOD) and limit <strong>of</strong> quantification<br />
(LOQ) were 0.10 mg L -1 and 0.33 mg L -1 , respectively.<br />
LOD and LOQ were estimated using the equation: LOD<br />
= 3s b /S and LOQ = 10s b /S, where S is the slope and s b<br />
is the blank solution standard deviation (n b = 8). The<br />
results obtained by the system were compared with<br />
those found using the Vacu-vials ® kit and the reference<br />
method based on permanganate-thiosulfate titration<br />
[12], as shown in Table II.<br />
taBlE ii. Co m P a r i s o n o f thE analytiCal fEaturEs aChiEvEd By thE<br />
P ro P o s E d m E t h o d, vaCu-vials ® ProCEdurE a n d rEfErEnCE m E t h o d<br />
[12] f o r PEraCEtiC aCid d E t E r m i n a t i o n in d i s i n fE C t a n t s samPlEs.<br />
Pa ra m E t E rs<br />
Pr o P o s E d<br />
m E t h o d<br />
kit va C uv<br />
i a l s ®<br />
rEfErEnCE<br />
m E t h o d<br />
Sample volume (µL) 200 25000 50000<br />
Reagent volume (µL) 80 2000 - a<br />
Linear range (mg L -1 ) 0.5 - 5.0 1.0 - 4.0 150 - 300<br />
LD (mg L -1 ) 0.10 NI NI<br />
RSD (%) 4.0 (3.0 mg L -1 ) NI NI<br />
<strong>Analytical</strong> throughput<br />
(h -1 )<br />
80 10 2<br />
Waste volume b (mL) 1.5 27 > 50<br />
NI: not informed. a Varies with the sample concentration. b Per<br />
determination<br />
Silva et al.<br />
The coefficient <strong>of</strong> variation (obtained using eight replicates<br />
<strong>of</strong> a 3 mg L -1 peracetic acid solution) was 4.0%.<br />
161