Brazilian Journal of Analytical Chemistry - BRJAC - Brazilian Journal ...
Brazilian Journal of Analytical Chemistry - BRJAC - Brazilian Journal ...
Brazilian Journal of Analytical Chemistry - BRJAC - Brazilian Journal ...

You also want an ePaper? Increase the reach of your titles
YUMPU automatically turns print PDFs into web optimized ePapers that Google loves.
a m u l t iC o m m u t a t e d flow system f o r peraCetiC a C i d determination<br />
2.3. ap p a r a t u s<br />
The flow system is schematically outlined in Figure 1.<br />
The FI manifold was composed <strong>of</strong> two 8 μL per stroke<br />
solenoid micro-pumps (P1 and P2), and one 10 μL per<br />
stroke solenoid micro-pump (P3) type Bio-chem 090SP<br />
(Boonton, NJ, USA); a microcomputer furnished with<br />
an electronic interface card PCL711S (American Advantech<br />
Co.); a 700S Femto spectrophotometer equipped<br />
with a flow cell, a 10 mm optical path and an 80 μL<br />
inner volume; a homemade electronic interface [29] to<br />
drive the solenoid micro-pumps; and a four-way acrylic<br />
connector. The reaction coil and flow lines were made<br />
from 0.8 mm i.d PTFE tubing. The control <strong>of</strong> the micro-pumps<br />
and data acquisition were performed by a<br />
microcomputer running with s<strong>of</strong>tware written in Quick<br />
BASIC 4.5. The micro-pumps were configured to function<br />
as micro-injectors and the microcomputer managed<br />
the drive, adding the same aliquots <strong>of</strong> reagent<br />
solution in the sequence required by the chemical reactions<br />
involved.<br />
2.4. pr o c e d u r e<br />
The proposed method is based on the reaction <strong>of</strong><br />
PAA with I - solution in excess. The concentration <strong>of</strong><br />
I - in the sample solution should be high enough to dis-<br />
solve the I resulting from the reaction <strong>of</strong> PAA with I 2 - .<br />
The I liberated reacts with I 2 - - forming I , it oxidizes the<br />
3<br />
DDPD, forming a purple colored complex with maximum<br />
absorbance at 565 nm. The reaction rate <strong>of</strong> PAA<br />
and I- is 5 orders <strong>of</strong> magnitude greater than that <strong>of</strong><br />
H O with I 2 2 - [30].<br />
Figure 1a shows the flow diagram <strong>of</strong> the system.<br />
All pumps are switched OFF, thus no solution is flowing<br />
through the system. When the s<strong>of</strong>tware was run,<br />
the microcomputer sent control signals through the<br />
PCL711S interface card to the switch ON/OFF <strong>of</strong> the<br />
solenoid micro-pumps, which carried out the switching<br />
pattern depicted in Figure 1b.<br />
The micro-pumps P1 and P2 were switched ON/OFF<br />
sequentially five and two times, respectively, thus inserting<br />
a string comprising five slugs <strong>of</strong> sample solution<br />
in and two slugs <strong>of</strong> reagent solution into the reaction<br />
coil (RC). Afterwards, the micro-pump P3 was<br />
switched ON/OFF several times to establish a stream<br />
<strong>of</strong> the carrier solution to displace the sample zone towards<br />
the photometer (Det).The mixing <strong>of</strong> solutions<br />
between slugs proceeded while the sample zone was<br />
displaced through the reaction coil RC, thus causing<br />
a reaction which produced the compound that was<br />
monitored at 565 nm. The control parameters are<br />
shown in Table I.<br />
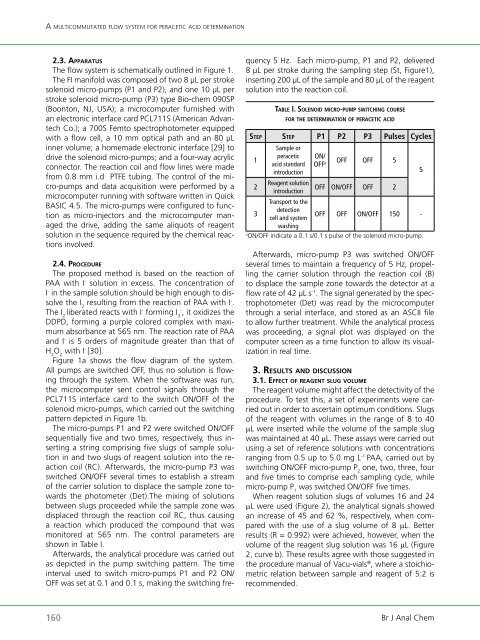
Afterwards, the analytical procedure was carried out<br />
as depicted in the pump switching pattern. The time<br />
interval used to switch micro-pumps P1 and P2 ON/<br />
OFF was set at 0.1 and 0.1 s, making the switching fre-<br />
quency 5 Hz. Each micro-pump, P1 and P2, delivered<br />
8 µL per stroke during the sampling step (St, Figure1),<br />
inserting 200 µL <strong>of</strong> the sample and 80 µL <strong>of</strong> the reagent<br />
solution into the reaction coil.<br />
taBlE i. so l E n o i d m iC r o-P u m P switChing C o u rs E<br />
f o r thE d E t E r m i n a t i o n o f PEraCEtiC aCid<br />
stEP stEP P1 P2 P3 Pulses Cycles<br />
160 Br J Anal Chem<br />
1<br />
2<br />
3<br />
Sample or<br />
peracetic<br />
acid standard<br />
introduction<br />
Reagent solution<br />
introduction<br />
Transport to the<br />
detection<br />
cell and system<br />
washing<br />
ON/<br />
OFF a OFF OFF 5<br />
OFF ON/OFF OFF 2<br />
OFF OFF ON/OFF 150 -<br />
a ON/OFF indicate a 0.1 s/0.1 s pulse <strong>of</strong> the solenoid micro-pump.<br />
Afterwards, micro-pump P3 was switched ON/OFF<br />
several times to maintain a frequency <strong>of</strong> 5 Hz, propelling<br />
the carrier solution through the reaction coil (B)<br />
to displace the sample zone towards the detector at a<br />
flow rate <strong>of</strong> 42 µL s -1 . The signal generated by the spectrophotometer<br />
(Det) was read by the microcomputer<br />
through a serial interface, and stored as an ASCII file<br />
to allow further treatment. While the analytical process<br />
was proceeding, a signal plot was displayed on the<br />
computer screen as a time function to allow its visualization<br />
in real time.<br />
3. results a n d dIscussIon<br />
3.1. eff e c t o f r e a g e n t s l u g v o l u m e<br />
The reagent volume might affect the detectivity <strong>of</strong> the<br />
procedure. To test this, a set <strong>of</strong> experiments were carried<br />
out in order to ascertain optimum conditions. Slugs<br />
<strong>of</strong> the reagent with volumes in the range <strong>of</strong> 8 to 40<br />
µL were inserted while the volume <strong>of</strong> the sample slug<br />
was maintained at 40 µL. These assays were carried out<br />
using a set <strong>of</strong> reference solutions with concentrations<br />
ranging from 0.5 up to 5.0 mg L -1 PAA, carried out by<br />
switching ON/OFF micro-pump P 2 one, two, three, four<br />
and five times to comprise each sampling cycle, while<br />
micro-pump P 1 was switched ON/OFF five times.<br />
When reagent solution slugs <strong>of</strong> volumes 16 and 24<br />
µL were used (Figure 2), the analytical signals showed<br />
an increase <strong>of</strong> 45 and 62 %, respectively, when compared<br />
with the use <strong>of</strong> a slug volume <strong>of</strong> 8 µL. Better<br />
results (R = 0.992) were achieved, however, when the<br />
volume <strong>of</strong> the reagent slug solution was 16 µL (Figure<br />
2, curve b). These results agree with those suggested in<br />
the procedure manual <strong>of</strong> Vacu-vials ® , where a stoichiometric<br />
relation between sample and reagent <strong>of</strong> 5:2 is<br />
recommended.<br />
5