Brazilian Journal of Analytical Chemistry - BRJAC - Brazilian Journal ...
Brazilian Journal of Analytical Chemistry - BRJAC - Brazilian Journal ...
Brazilian Journal of Analytical Chemistry - BRJAC - Brazilian Journal ...

Create successful ePaper yourself
Turn your PDF publications into a flip-book with our unique Google optimized e-Paper software.
ChemometriC a n d a n a l y t iC a l strategies f o r t h e s t u d y o f s o i l s f r o m m a r i t i m e an t a rC t iC a<br />
use <strong>of</strong> an autosampler that spends at least 10 s for each<br />
sample. The STAT-FAAS became an interesting strategy<br />
for fast sequential determination <strong>of</strong> Cd and Pb, because<br />
it combines high analytical throughput (the same<br />
observed by FS-FAAS) and good LODs (limits <strong>of</strong> detection,<br />
defined by IUPAC as three times the standard deviation<br />
<strong>of</strong> the blank (n=10) divided by the slope <strong>of</strong> the<br />
calibration curve) with intermediate values between<br />
the conventional FAAS and TS-FF-AAS. The poorer performance<br />
<strong>of</strong> TS-FF-AAS in the fast-sequential mode, in<br />
relation to analytical throughput, for Cd and Pb determination,<br />
is due to the signal stabilization time (60 s for<br />
each sample) before starting the measurements.<br />
3.4. chemometrIc treatment o f s o Il c h e m Ic a l a n a l y s e s:<br />
metal c o n c e n t r a t Io n s a n d s o Il c h a r a c t e r I s t I c s<br />
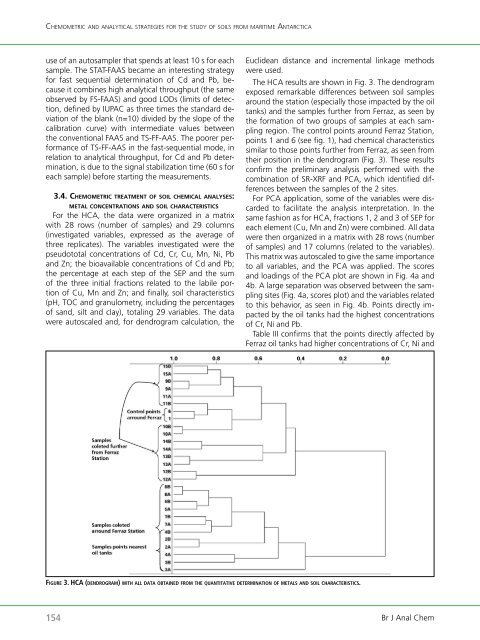
For the HCA, the data were organized in a matrix<br />
with 28 rows (number <strong>of</strong> samples) and 29 columns<br />
(investigated variables, expressed as the average <strong>of</strong><br />
three replicates). The variables investigated were the<br />
pseudototal concentrations <strong>of</strong> Cd, Cr, Cu, Mn, Ni, Pb<br />
and Zn; the bioavailable concentrations <strong>of</strong> Cd and Pb;<br />
the percentage at each step <strong>of</strong> the SEP and the sum<br />
<strong>of</strong> the three initial fractions related to the labile portion<br />
<strong>of</strong> Cu, Mn and Zn; and finally, soil characteristics<br />
(pH, TOC and granulometry, including the percentages<br />
<strong>of</strong> sand, silt and clay), totaling 29 variables. The data<br />
were autoscaled and, for dendrogram calculation, the<br />
Euclidean distance and incremental linkage methods<br />
were used.<br />
The HCA results are shown in Fig. 3. The dendrogram<br />
exposed remarkable differences between soil samples<br />
around the station (especially those impacted by the oil<br />
tanks) and the samples further from Ferraz, as seen by<br />
the formation <strong>of</strong> two groups <strong>of</strong> samples at each sampling<br />
region. The control points around Ferraz Station,<br />
points 1 and 6 (see fig. 1), had chemical characteristics<br />
similar to those points further from Ferraz, as seen from<br />
their position in the dendrogram (Fig. 3). These results<br />
confirm the preliminary analysis performed with the<br />
combination <strong>of</strong> SR-XRF and PCA, which identified differences<br />
between the samples <strong>of</strong> the 2 sites.<br />
For PCA application, some <strong>of</strong> the variables were discarded<br />
to facilitate the analysis interpretation. In the<br />
same fashion as for HCA, fractions 1, 2 and 3 <strong>of</strong> SEP for<br />
each element (Cu, Mn and Zn) were combined. All data<br />
were then organized in a matrix with 28 rows (number<br />
<strong>of</strong> samples) and 17 columns (related to the variables).<br />
This matrix was autoscaled to give the same importance<br />
to all variables, and the PCA was applied. The scores<br />
and loadings <strong>of</strong> the PCA plot are shown in Fig. 4a and<br />
4b. A large separation was observed between the sampling<br />
sites (Fig. 4a, scores plot) and the variables related<br />
to this behavior, as seen in Fig. 4b. Points directly impacted<br />
by the oil tanks had the highest concentrations<br />
<strong>of</strong> Cr, Ni and Pb.<br />
Table III confirms that the points directly affected by<br />
Ferraz oil tanks had higher concentrations <strong>of</strong> Cr, Ni and<br />
fi g u rE 3. hCa (d E n d ro g ra m) w i t h all d a t a o B t a i nE d f ro m thE quantitativE d E t E r m i n a t i o n o f m E t a l s a n d s o i l CharaCtEristiCs.<br />
154 Br J Anal Chem