Brazilian Journal of Analytical Chemistry - BRJAC - Brazilian Journal ...
Brazilian Journal of Analytical Chemistry - BRJAC - Brazilian Journal ...
Brazilian Journal of Analytical Chemistry - BRJAC - Brazilian Journal ...

Create successful ePaper yourself
Turn your PDF publications into a flip-book with our unique Google optimized e-Paper software.
cm) pieces, mixed with dry ice to avoid loss <strong>of</strong> volatile<br />
species and pulverized in a stainless steel blender<br />
(Cole Parmer, Vernon Hills, IL, USA). The samples were<br />
ground, sieved (particle size ranging from 75 µm to 100<br />
µm) and stored in closed flasks under refrigeration prior<br />
to use.<br />
2.3. fims<br />
All FIMS analysis were performed in an Extrel Mass<br />
Spectrometer (Pittsburgh, PA, USA) fitted with a hightransmission<br />
¾” quadrupole and an EI ion source. The<br />
ion source <strong>of</strong> the MS was modified as previously described<br />
[20] to allow a SPME fiber to be placed directly<br />
between the two parallel MS filaments for uniform<br />
heating and efficient desorption <strong>of</strong> the analytes (Figure<br />
1), being ionized by 70 eV EI. The desorption time was<br />
60 s for all experiments and no carryover between runs<br />
was observed with this time. The MS gain and electron<br />
multiplier voltages were 1 x 10 10 and 1100 V, respectively.<br />
Detection and quantification <strong>of</strong> the CP were performed<br />
by selective ion monitoring (SIM) <strong>of</strong> diagnostic<br />
fragment ions <strong>of</strong> m/z 107 for 4-chloro-3-methylphenol,<br />
m/z 128 for 2-chlorophenol, m/z 196 for 2,4,6-trichlorophenol<br />
and m/z 266 for pentachlorophenol.<br />
2.4. PrE P a ra t i o n o f t h E s o l-g E l aPtms / Pdms fiBEr<br />
Two centimeter pieces <strong>of</strong> the optical fiber were dipped<br />
in concentrated sulfuric acid for 3 h for removal <strong>of</strong> the<br />
protective polyimide layer. In sequence, the uncoated<br />
fibers were exposed for 1 h to 1 mol L -1 NaOH solution,<br />
to activate its surface. The activated fibers were<br />
subsequently washed with 0.1 mol L -1 HCl for removing<br />
the excess base, rinsed with distilled water, dried<br />
at 70°C and stored in a desiccator. The sol-gel reaction<br />
was carried out in a 3 mL disposable polyethylene vial:<br />
300 mg <strong>of</strong> APTMS, 75 mg <strong>of</strong> MTMS, 150 mg <strong>of</strong> PDMS-<br />
OH and 125 μL <strong>of</strong> TFA (with 5 % <strong>of</strong> water) were mixed.<br />
The mixture was vortexed for 2 min; the dry activated<br />
fused silica fibers were exposed to the resulting sol for<br />
1 h at lab temperature (22 °C – 27 °C), removed from<br />
the sol and stored overnight in a desiccator. This procedure<br />
was repeated five times with fresh sol, in order to<br />
obtain thicker coatings. The fibers were then exposed<br />
to a solution <strong>of</strong> 20 % methanolic solution <strong>of</strong> MTMS<br />
for 5 minutes, to end-cap residual superficial hydroxyls.<br />
Finally, the fibers were mounted on used, discarded<br />
commercial (Supelco) SPME assemblies, after careful<br />
removal <strong>of</strong> the original (deteriorated) fiber. Prior to use,<br />
the fibers were conditioned at 100°C for 1 h and then<br />
at 260°C for 6 h in the injection port <strong>of</strong> a gas chromatograph<br />
under flow <strong>of</strong> nitrogen (1 mL min -1 ).<br />
2.5. sPmE<br />
Water Samples. The extraction pr<strong>of</strong>iles for the CP using<br />
the APTMS / PDMS fiber were determined using<br />
www.brjac.com.br<br />
determination o f C h l o ro p h e n o l s in e n v i ro n m e n t a l samples by fiber i n t ro d uC t i o n m a s s<br />
speCtrometry u s i n g a n o v e l s o l-g e l fiber<br />
aqueous solutions containing 100 µg L -1 <strong>of</strong> each analyte<br />
as sample. Due to the acidity <strong>of</strong> the analytes (pK a<br />
ranging from 4.8 to 7.8), and to maintain the CP in<br />
their protonated forms so as to maximize their sorption<br />
by the fiber coating, the pH <strong>of</strong> the aqueous samples<br />
were adjusted to 1.0 prior to all extractions by dropwise<br />
adding <strong>of</strong> conc. HCl (10 µL to 15 µL). For the extractions,<br />
the APTMS / PDMS fiber was immersed in 10 mL<br />
<strong>of</strong> test sample in septum-sealed glass sample vials under<br />
magnetic stirring <strong>of</strong> 1000 rpm, for periods ranging<br />
from 1.0 to 20 min. After extraction, the analytes were<br />
immediately desorbed inside the MS. <strong>Analytical</strong> curves<br />
were obtained for the concentration range between 25<br />
and 400 µg L -1 and the optimized extraction time <strong>of</strong> 7.5<br />
min allowed assessment <strong>of</strong> quantitative figures <strong>of</strong> merit<br />
<strong>of</strong> the method. The LOD and the limits <strong>of</strong> quantitation<br />
(LOQ) were calculated from signal-to-noise ratios (S/N)<br />
<strong>of</strong> 3 and 10, respectively, estimated from data collected<br />
from extractions <strong>of</strong> 25 µg L -1 <strong>of</strong> the CP. The recovery<br />
was estimated with creek water samples spiked with<br />
100 µg L -1 <strong>of</strong> each analyte.<br />
Samples <strong>of</strong> sleeper wood. A suspension <strong>of</strong> 1.000 g <strong>of</strong><br />
powdered wood sample in 6 mL <strong>of</strong> a water / methanol<br />
mixture (5:1 v/v) was stirred for 1 h at room temperature.<br />
This suspension was filtered, acidified and quantitatively<br />
transferred to vials for SPME analysis, which<br />
were carried out using the same parameters as above.<br />
Quantitation was then performed via analytical curves<br />
obtained by extractions <strong>of</strong> standard solutions <strong>of</strong> the<br />
analytes in water / methanol mixtures.<br />
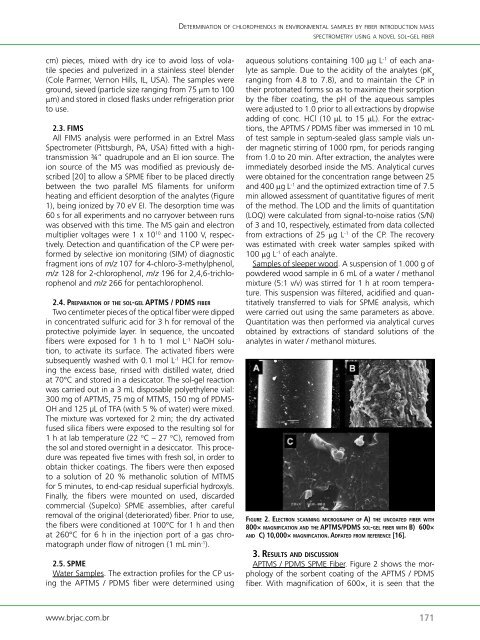
fi g u rE 2. El E C t ro n s C a n n i n g m iC ro g ra P h y o f a) thE u n C o a t E d fiBEr w i t h<br />
800× m a g n i f iC a t i o n a n d thE aPtms/Pdms s o l-g E l fiBEr w i t h B) 600×<br />
a n d C) 10,000× m a g n i f iC a t i o n. ad P a t E d f ro m rEfErEnCE [16].<br />
3. rEsults a n d disCussion<br />
APTMS / PDMS SPME Fiber. Figure 2 shows the morphology<br />
<strong>of</strong> the sorbent coating <strong>of</strong> the APTMS / PDMS<br />
fiber. With magnification <strong>of</strong> 600×, it is seen that the<br />
171