Brazilian Journal of Analytical Chemistry - BRJAC - Brazilian Journal ...
Brazilian Journal of Analytical Chemistry - BRJAC - Brazilian Journal ...
Brazilian Journal of Analytical Chemistry - BRJAC - Brazilian Journal ...

You also want an ePaper? Increase the reach of your titles
YUMPU automatically turns print PDFs into web optimized ePapers that Google loves.
Eberlin et al.<br />
surface is very irregular, with the appearance <strong>of</strong> an agglomerate<br />
<strong>of</strong> globular and/or cylindrical elements <strong>of</strong> ~ 5<br />
µm or less. Accurate measurement <strong>of</strong> the coating thickness<br />
is not feasible, due to this rough and irregular surface.<br />
Comparing the coated fiber (Figure 2B, fiber thickness<br />
<strong>of</strong> 194 ± 4 µm) with an uncoated fused silica fiber<br />
(Figure 2A, fiber thickness <strong>of</strong> 130 µm), the film thickness<br />
is calculated to be 32 ± 2 µm. Apart from preventing an<br />
accurate estimation <strong>of</strong> thickness, this irregular surface is<br />
an attractive characteristic for a SPME fiber since it leads<br />
to an increase in the surface area <strong>of</strong> the fiber exposed<br />
to analytes or to the vaccuum inside the MS ionization<br />
chamber, allowing faster mass transfer <strong>of</strong> analytes to and<br />
from the fiber. The microstructure <strong>of</strong> the coating can be<br />
inspected after 10k× magnification (Figure 2C), and the<br />
APTMS / PDMS surface appears here as being compact<br />
and non-porous. The material seems to be a cluster <strong>of</strong><br />
scale-like pieces, and no macro- or mesoporous structures<br />
are visible. The lack <strong>of</strong> a pore system can be considered<br />
a drawback since irregular surfaces improve the<br />
performance <strong>of</strong> SPME fibers. But, apparently, the analytical<br />
performance <strong>of</strong> the fiber is not affected by this feature,<br />
as demonstrated elsewhere [16]. The coating also<br />
seems to maintain its integrity even after 200 extraction<br />
and desorption cycles. This endurance is relevant,<br />
since both processes occur under conditions which are<br />
particularly aggressive to SPME fibers: the extraction is<br />
performed by its immersion in acidified media, and the<br />
fiber is directly exposed to heating from the EI filaments.<br />
This robustness, not so typical for conventional fibers, is<br />
typical <strong>of</strong> sol-gel coated SPME fibers, probably due to the<br />
chemical bonding between the coating and the fused<br />
silica support.<br />
fi g u rE 3. sPmE ExtraCtion P r o f i l E o f CP f ro m a q u E o u s s o l u t i o n s (100<br />
µg l -1 ) in Ph 1.<br />
Extraction and MS Signal Pr<strong>of</strong>iles. Figure 3 shows FIMS<br />
(APTMS/PDMS) extraction pr<strong>of</strong>iles for all CP investigated.<br />
Equilibration is reached for periods ranging from<br />
~6 min (PCP, 43CP) to ~13 min (246CP). These results<br />
show that the equilibration is extremely fast, compared<br />
to typical values <strong>of</strong> 60 min or more obtained for CP<br />
with commercial SPME fibers. Such fast equilibration is<br />
characteristic <strong>of</strong> sol-gel coated SPME fibers. Since the<br />
coatings provided by the sol-gel process are thinner,<br />
equilibration with sample is more rapidly achieved, in<br />
comparison with thicker coatings from commercial fibers.<br />
For these results, a time <strong>of</strong> 7.5 min was chosen<br />
as ideal for direct extraction, with the solution pH adjusted<br />
to 1 and with no CP derivatization. The standard<br />
relative deviation presented in CP ranged from 1.4%<br />
to 25%. Considering the extreme extraction and desorption<br />
conditions, and the considerable gains in speed<br />
and simplicity, these values seem quite acceptable.<br />
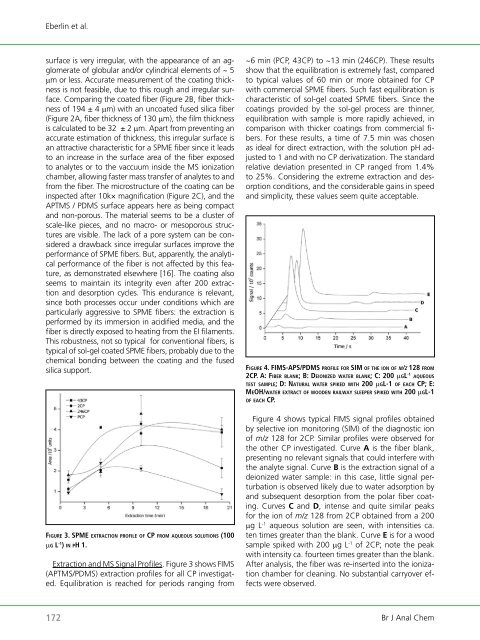
fi g u r E 4. fims-aPs/Pdms P r o f i l E f o r sim o f t h E i o n o f m/z 128 f ro m<br />
2CP. a: fiBEr B l a n k; B: dEionizEd w a t E r B l a n k; C: 200 µgl -1 a q u E o u s<br />
tEst s a m P l E; d: na t u ra l w a t E r sPikEd w i t h 200 µgl-1 o f E a C h CP; E:<br />
mEoh/w a t E r E x t ra C t o f w o o d E n ra i l w a y slEEPEr sPikEd w i t h 200 µgl-1<br />
o f E a C h CP.<br />
Figure 4 shows typical FIMS signal pr<strong>of</strong>iles obtained<br />
by selective ion monitoring (SIM) <strong>of</strong> the diagnostic ion<br />
<strong>of</strong> m/z 128 for 2CP. Similar pr<strong>of</strong>iles were observed for<br />
the other CP investigated. Curve A is the fiber blank,<br />
presenting no relevant signals that could interfere with<br />
the analyte signal. Curve B is the extraction signal <strong>of</strong> a<br />
deionized water sample: in this case, little signal perturbation<br />
is observed likely due to water adsorption by<br />
and subsequent desorption from the polar fiber coating.<br />
Curves C and D, intense and quite similar peaks<br />
for the ion <strong>of</strong> m/z 128 from 2CP obtained from a 200<br />
µg L -1 aqueous solution are seen, with intensities ca.<br />
ten times greater than the blank. Curve E is for a wood<br />
sample spiked with 200 µg L -1 <strong>of</strong> 2CP; note the peak<br />
with intensity ca. fourteen times greater than the blank.<br />
After analysis, the fiber was re-inserted into the ionization<br />
chamber for cleaning. No substantial carryover effects<br />
were observed.<br />
172 Br J Anal Chem