- Page 1 and 2:
PROGRESS® 10 OPENEDGE® OpenEdge®
- Page 3 and 4:
Contents Preface . . . . . . . . .
- Page 5 and 6:
Contents Values of output parameter
- Page 7 and 8:
Contents 8. Troubleshooting. . . .
- Page 9 and 10:
Tables Contents Table 1-1: DataServ
- Page 11 and 12:
Examples Contents Example 3-1: Pass
- Page 13 and 14:
Preface This Preface contains the f
- Page 15 and 16:
Chapter 5, “Configuring the DataS
- Page 17 and 18:
Typographical conventions This manu
- Page 19 and 20:
Preface A called external procedure
- Page 21 and 22:
Preface Obtaining more information
- Page 23 and 24:
Preface Copyright © 1991 by Lucent
- Page 25 and 26:
Preface OpenEdge includes Sonic sof
- Page 27 and 28:
Preface WARRANTIES, INCLUDING, BUT
- Page 29 and 30:
Introduction 1 The OpenEdge® DataS
- Page 31 and 32:
DataServer components DataServer co
- Page 33 and 34:
DataServer for MS SQL Server logic
- Page 35 and 36:
DataServer components If you plan t
- Page 37 and 38:
DataServer utilities DataServer uti
- Page 39 and 40:
DataServer configurations DataServe
- Page 41 and 42:
DataServer configurations Configuri
- Page 43 and 44:
Typical configuration scenarios Dat
- Page 45 and 46:
Guidelines for using the DataServer
- Page 47 and 48:
Documentation resources Documentati
- Page 49 and 50:
Initial Programming Considerations
- Page 51 and 52:
Database design issues Database des
- Page 53 and 54:
MS SQL Server DataServer data sourc
- Page 55 and 56:
Database design issues For example,
- Page 57 and 58:
Support for Unicode Database design
- Page 59 and 60:
Database design issues restrictions
- Page 61 and 62:
Database design issues For example,
- Page 63 and 64:
OpenEdge sequences Database design
- Page 65 and 66:
Data types MS SQL Server data types
- Page 67 and 68:
Table 2-5: MS SQL Server data type
- Page 69 and 70:
Determining your application needs
- Page 71 and 72:
Data types The ABL DATETIME and DAT
- Page 73 and 74:
Data types Table 2-10 provides deta
- Page 75 and 76:
Schema Migration > OpenEdge DB to M
- Page 77 and 78:
Default and Special Datetime Defaul
- Page 79 and 80:
Table 2-12 depicts mapping between
- Page 81 and 82:
Record creation Record creation Rec
- Page 83 and 84:
Record creation The VALIDATE or REL
- Page 85 and 86:
Share locks Data source record lock
- Page 87 and 88:
Additional record locking details D
- Page 89 and 90:
Data source record locking to be lo
- Page 91 and 92:
Transactions Transactions With Data
- Page 93 and 94:
Error handling Error handling One c
- Page 95 and 96:
Overflow checking Error handling Ov
- Page 97 and 98:
Impact of MAX-ROWS Cursors The MAX-
- Page 99 and 100:
Block cursors on versus off Cursors
- Page 101 and 102:
ABL issues • If you force the cre
- Page 103 and 104:
ABL issues Include the SCROLLING op
- Page 105 and 106:
ABL issues When you run find.p with
- Page 107 and 108:
NO-LOCK option 1 SHARE-LOCK option
- Page 109 and 110:
RDBMS Stored Procedure Details 3 Th
- Page 111 and 112:
RDBMS stored procedure basics RDBMS
- Page 113 and 114:
RDBMS stored procedure basics schem
- Page 115 and 116:
Run Stored-Procedure details •
- Page 117 and 118:
Run Stored-Procedure details An exp
- Page 119 and 120:
Run Stored-Proc statement execution
- Page 121 and 122:
Data output and retrieval options D
- Page 123 and 124:
Interfacing with RDBMS stored proce
- Page 125 and 126:
Technique to use proc-text-buffer I
- Page 127 and 128:
Interfacing with RDBMS stored proce
- Page 129 and 130:
Loading result sets into temp-table
- Page 131 and 132:
Interfacing with RDBMS stored proce
- Page 133 and 134:
Details about a dynamic temp-table
- Page 135 and 136:
Interfacing with RDBMS stored proce
- Page 137 and 138:
Interfacing with RDBMS stored proce
- Page 139 and 140:
Handling errors • If you try to e
- Page 141 and 142:
ROWID Support It is important to no
- Page 143 and 144:
ROWID Support If the table uses com
- Page 145 and 146:
DEFINE VARIABLE hSendSQL AS HANDLE
- Page 147 and 148:
Additional Features to Enhance Data
- Page 149 and 150:
Enhancements overview For installat
- Page 151 and 152:
Firehose and Fast Forward-Only Curs
- Page 153 and 154:
• Lowest connection value • Num
- Page 155 and 156:
Query tuning Query tuning How you s
- Page 157 and 158:
LOOKAHEAD NO-LOOKAHEAD SEPARATE-CON
- Page 159 and 160:
Caching records Caching records The
- Page 161 and 162:
Join by SQLDB FOR EACH customer, EA
- Page 163 and 164:
Modifying the run-time schema check
- Page 165 and 166:
Configuring the DataServer 5 Config
- Page 167 and 168:
DataServer components Table 5-1: In
- Page 169 and 170:
Configuring a local DataServer Conf
- Page 171 and 172:
Configuring a remote DataServer 5.
- Page 173 and 174:
Configuring a remote DataServer For
- Page 175 and 176:
Configuring a remote DataServer Whe
- Page 177 and 178:
Configuring a remote DataServer The
- Page 179 and 180:
Creating a schema holder Creating a
- Page 181 and 182:
Creating a schema holder 4. Start t
- Page 183 and 184:
Creating a schema holder Table 5-4
- Page 185 and 186:
Creating a schema holder You can al
- Page 187 and 188:
Typical configuration for a remote
- Page 189 and 190:
Typical configuration for a remote
- Page 191 and 192:
Connecting the DataServer You can s
- Page 193 and 194:
Starting a remote DataServer Starti
- Page 195 and 196:
Starting a remote DataServer Starti
- Page 197 and 198:
Starting a remote DataServer For ex
- Page 199 and 200:
Connecting a schema holder Connecti
- Page 201 and 202:
Direct Connect (-DirectConnect) Pas
- Page 203 and 204:
Note the following command syntax u
- Page 205 and 206:
Use the PRGRS_CONNECT parameter in
- Page 207 and 208:
Connecting a schema holder Table 6-
- Page 209 and 210:
Connecting a schema holder Table 6-
- Page 211 and 212:
Connecting a schema holder 3. The v
- Page 213 and 214:
Connecting a schema holder Table 6-
- Page 215 and 216:
Connecting a schema holder Note: Ap
- Page 217 and 218:
Connecting a schema holder The ABL
- Page 219 and 220:
Connection troubleshooting Connecti
- Page 221 and 222:
Setting the log file location Conne
- Page 223 and 224:
The DataServer Tutorial 7 This chap
- Page 225 and 226:
Preparing to create demonstration d
- Page 227 and 228:
Preparing to create demonstration d
- Page 229 and 230:
DataServer utilities When you acces
- Page 231 and 232:
Creating a schema holder 4. In the
- Page 233 and 234:
Updating a schema holder Updating a
- Page 235 and 236:
Verifying a schema holder Verifying
- Page 237 and 238:
Verifying a schema holder 4. There
- Page 239 and 240:
Changing connection information in
- Page 241 and 242:
Deleting a schema holder Deleting a
- Page 243 and 244:
Migrating an OpenEdge database to M
- Page 245 and 246:
Migrating an OpenEdge database to M
- Page 247 and 248:
Migrating an OpenEdge database to M
- Page 249 and 250:
Delta df to MS SQL Server Increment
- Page 251 and 252:
Delta df to MS SQL Server Increment
- Page 253 and 254: Delta df to MS SQL Server Increment
- Page 255 and 256: Modifying field-level information Y
- Page 257 and 258: Defining the ROWID Modifying a sche
- Page 259 and 260: Adding extended ABL support Adding
- Page 261 and 262: Adding extended ABL support Using c
- Page 263 and 264: Adding extended ABL support create
- Page 265 and 266: Troubleshooting This chapter descri
- Page 267 and 268: ODBC options Tuning your environmen
- Page 269 and 270: Tuning your environment with the -D
- Page 271 and 272: Tuning your environment with the -D
- Page 273 and 274: Tuning your environment with the -D
- Page 275 and 276: SVUB,x—the Unified Broker Server
- Page 277 and 278: Adjusting values Tuning your enviro
- Page 279 and 280: Migration Issues A This appendix di
- Page 281 and 282: Modifying your application Note the
- Page 283 and 284: Sample code for the db.owner.Custom
- Page 285 and 286: Server Related Command Line Utiliti
- Page 287 and 288: -validate -help Progress Explorer c
- Page 289 and 290: -host host-name Progress Explorer c
- Page 291 and 292: Progress Explorer command line util
- Page 293 and 294: -user user-name Progress Explorer c
- Page 295 and 296: Syntax Parameters service-name PROB
- Page 297 and 298: Non-Progress Explorer command line
- Page 299 and 300: Data Type Details C This appendix s
- Page 301 and 302: ntext 9 nvarchar(max) SQL_NLONGVARC
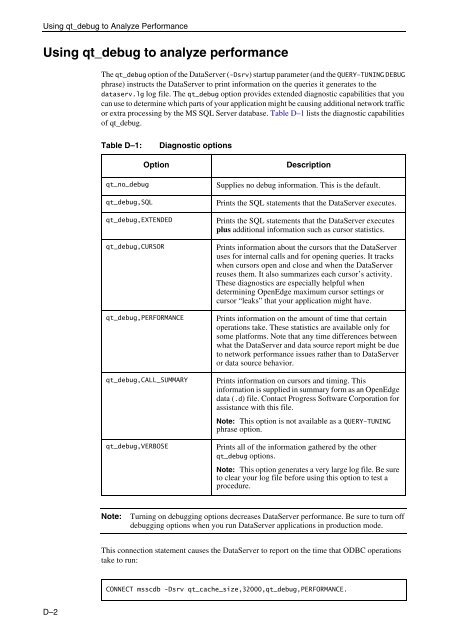
- Page 303: Using qt_debug to Analyze Performan
- Page 307 and 308: Data types 2-17, C-1 changing 7-34
- Page 309 and 310: K Key buffer troubleshooting 8-8 Ke
- Page 311 and 312: Progress Explorer Framework 5-23 an
- Page 313 and 314: Service Name (-S) shutdown paramete