Burden of Sport Injuries in the European Union - Safety in Sports
Burden of Sport Injuries in the European Union - Safety in Sports
Burden of Sport Injuries in the European Union - Safety in Sports

Create successful ePaper yourself
Turn your PDF publications into a flip-book with our unique Google optimized e-Paper software.
90%<br />
80%<br />
70%<br />
60%<br />
50%<br />
40%<br />
30%<br />
20%<br />
10%<br />
0%<br />
57<br />
10 | February 2012<br />
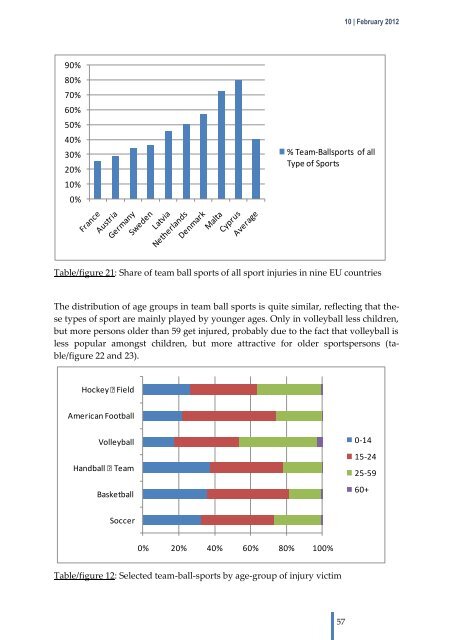
Table/figure 21: Share <strong>of</strong> team ball sports <strong>of</strong> all sport <strong>in</strong>juries <strong>in</strong> n<strong>in</strong>e EU countries<br />
The distribution <strong>of</strong> age groups <strong>in</strong> team ball sports is quite similar, reflect<strong>in</strong>g that <strong>the</strong>se<br />
types <strong>of</strong> sport are ma<strong>in</strong>ly played by younger ages. Only <strong>in</strong> volleyball less children,<br />
but more persons older than 59 get <strong>in</strong>jured, probably due to <strong>the</strong> fact that volleyball is<br />
less popular amongst children, but more attractive for older sportspersons (table/figure<br />
22 and 23).<br />
Hockey Field<br />
American Football<br />
Volleyball<br />
Handball Team<br />
Basketball<br />
Soccer<br />
% Team-Ballsports <strong>of</strong> all<br />
Type <strong>of</strong> <strong>Sport</strong>s<br />
0% 20% 40% 60% 80% 100%<br />
Table/figure 12: Selected team-ball-sports by age-group <strong>of</strong> <strong>in</strong>jury victim<br />
0-14<br />
15-24<br />
25-59<br />
60+