Equilibrium Growth, Inflation, and Bond Yields - Duke University's ...
Equilibrium Growth, Inflation, and Bond Yields - Duke University's ...
Equilibrium Growth, Inflation, and Bond Yields - Duke University's ...
You also want an ePaper? Increase the reach of your titles
YUMPU automatically turns print PDFs into web optimized ePapers that Google loves.
nominal yield curve <strong>and</strong> sizeable term spread. 29<br />
I first begin with a discussion of the equilibrium inflation <strong>and</strong> growth dynamics. Note that in the<br />
bottom row of Figure 1 the benchmark model (ENDO 1) replicates the negative low-frequency patterns in<br />
consumption growth <strong>and</strong> inflation from the data. As before, the low-frequency component is identified using<br />
a b<strong>and</strong>pass filter, where the b<strong>and</strong>width is from 32 to 200 quarters. Indeed, Table 10 shows that the ENDO 1<br />
closely matches low-frequency correlations between macro growth rates <strong>and</strong> inflation. Furthermore, expected<br />
consumption growth <strong>and</strong> expected inflation are strongly negatively correlated. To underst<strong>and</strong> the mechanics<br />
behind these endogenous long-run dynamics, it is instructive to look at the impulse response functions from<br />
Figure 6. First, I will focus on the IRFs for ENDO 1 which correspond to the solid lines. When a good<br />
productivity shock is realized, expected growth rates, including consumption growth, increase persistently<br />
as discussed above. Now, I will also show that expected inflation declines persistently in response to a good<br />
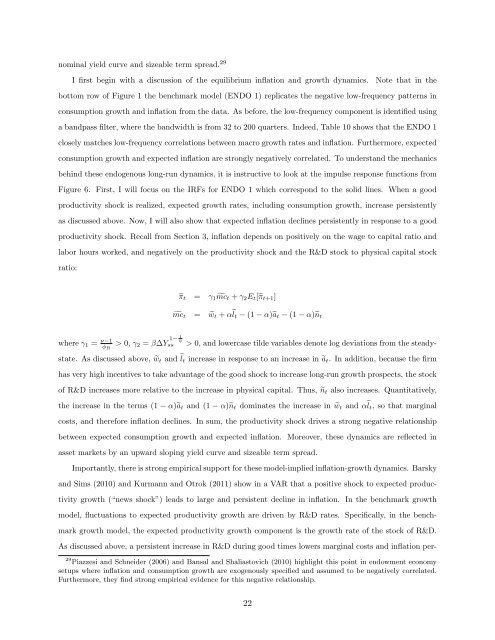
productivity shock. Recall from Section 3, inflation depends on positively on the wage to capital ratio <strong>and</strong><br />
labor hours worked, <strong>and</strong> negatively on the productivity shock <strong>and</strong> the R&D stock to physical capital stock<br />
ratio:<br />
where γ1 = ν−1<br />
φR > 0, γ2 = β∆Y<br />
�πt = γ1 �mct + γ2Et[�πt+1]<br />
�mct = �wt + α � lt − (1 − α)�at − (1 − α)�nt<br />
1 1− ψ<br />
ss<br />
> 0, <strong>and</strong> lowercase tilde variables denote log deviations from the steady-<br />
state. As discussed above, �wt <strong>and</strong> � lt increase in response to an increase in �at. In addition, because the firm<br />
has very high incentives to take advantage of the good shock to increase long-run growth prospects, the stock<br />
of R&D increases more relative to the increase in physical capital. Thus, �nt also increases. Quantitatively,<br />
the increase in the terms (1 − α)�at <strong>and</strong> (1 − α)�nt dominates the increase in �wt <strong>and</strong> α � lt, so that marginal<br />
costs, <strong>and</strong> therefore inflation declines. In sum, the productivity shock drives a strong negative relationship<br />
between expected consumption growth <strong>and</strong> expected inflation. Moreover, these dynamics are reflected in<br />
asset markets by an upward sloping yield curve <strong>and</strong> sizeable term spread.<br />
Importantly, there is strong empirical support for these model-implied inflation-growth dynamics. Barsky<br />
<strong>and</strong> Sims (2010) <strong>and</strong> Kurmann <strong>and</strong> Otrok (2011) show in a VAR that a positive shock to expected produc-<br />
tivity growth (“news shock”) leads to large <strong>and</strong> persistent decline in inflation. In the benchmark growth<br />
model, fluctuations to expected productivity growth are driven by R&D rates. Specifically, in the bench-<br />
mark growth model, the expected productivity growth component is the growth rate of the stock of R&D.<br />
As discussed above, a persistent increase in R&D during good times lowers marginal costs <strong>and</strong> inflation per-<br />
29 Piazzesi <strong>and</strong> Schneider (2006) <strong>and</strong> Bansal <strong>and</strong> Shaliastovich (2010) highlight this point in endowment economy<br />
setups where inflation <strong>and</strong> consumption growth are exogenously specified <strong>and</strong> assumed to be negatively correlated.<br />
Furthermore, they find strong empirical evidence for this negative relationship.<br />
22


