Equilibrium Growth, Inflation, and Bond Yields - Duke University's ...
Equilibrium Growth, Inflation, and Bond Yields - Duke University's ...
Equilibrium Growth, Inflation, and Bond Yields - Duke University's ...

You also want an ePaper? Increase the reach of your titles
YUMPU automatically turns print PDFs into web optimized ePapers that Google loves.
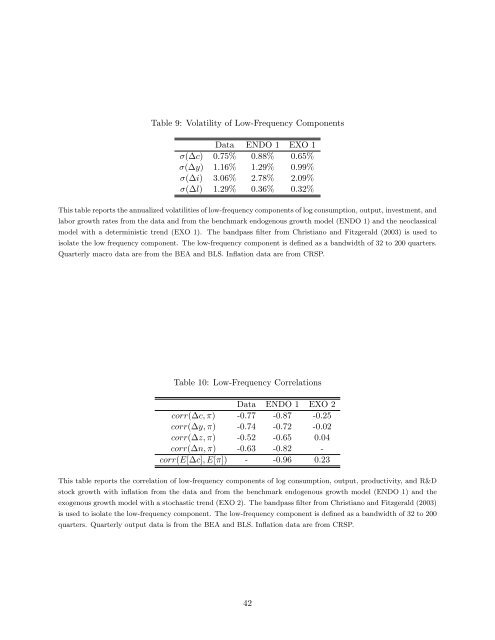
Table 9: Volatility of Low-Frequency Components<br />
Data ENDO 1 EXO 1<br />
σ(∆c) 0.75% 0.88% 0.65%<br />
σ(∆y) 1.16% 1.29% 0.99%<br />
σ(∆i) 3.06% 2.78% 2.09%<br />
σ(∆l) 1.29% 0.36% 0.32%<br />
This table reports the annualized volatilities of low-frequency components of log consumption, output, investment, <strong>and</strong><br />
labor growth rates from the data <strong>and</strong> from the benchmark endogenous growth model (ENDO 1) <strong>and</strong> the neoclassical<br />
model with a deterministic trend (EXO 1). The b<strong>and</strong>pass filter from Christiano <strong>and</strong> Fitzgerald (2003) is used to<br />
isolate the low frequency component. The low-frequency component is defined as a b<strong>and</strong>width of 32 to 200 quarters.<br />
Quarterly macro data are from the BEA <strong>and</strong> BLS. <strong>Inflation</strong> data are from CRSP.<br />
Table 10: Low-Frequency Correlations<br />
Data ENDO 1 EXO 2<br />
corr(∆c, π) -0.77 -0.87 -0.25<br />
corr(∆y, π) -0.74 -0.72 -0.02<br />
corr(∆z, π) -0.52 -0.65 0.04<br />
corr(∆n, π) -0.63 -0.82 -<br />
corr(E[∆c], E[π]) - -0.96 0.23<br />
This table reports the correlation of low-frequency components of log consumption, output, productivity, <strong>and</strong> R&D<br />
stock growth with inflation from the data <strong>and</strong> from the benchmark endogenous growth model (ENDO 1) <strong>and</strong> the<br />
exogenous growth model with a stochastic trend (EXO 2). The b<strong>and</strong>pass filter from Christiano <strong>and</strong> Fitzgerald (2003)<br />
is used to isolate the low-frequency component. The low-frequency component is defined as a b<strong>and</strong>width of 32 to 200<br />
quarters. Quarterly output data is from the BEA <strong>and</strong> BLS. <strong>Inflation</strong> data are from CRSP.<br />
42