Equilibrium Growth, Inflation, and Bond Yields - Duke University's ...
Equilibrium Growth, Inflation, and Bond Yields - Duke University's ...
Equilibrium Growth, Inflation, and Bond Yields - Duke University's ...

Create successful ePaper yourself
Turn your PDF publications into a flip-book with our unique Google optimized e-Paper software.
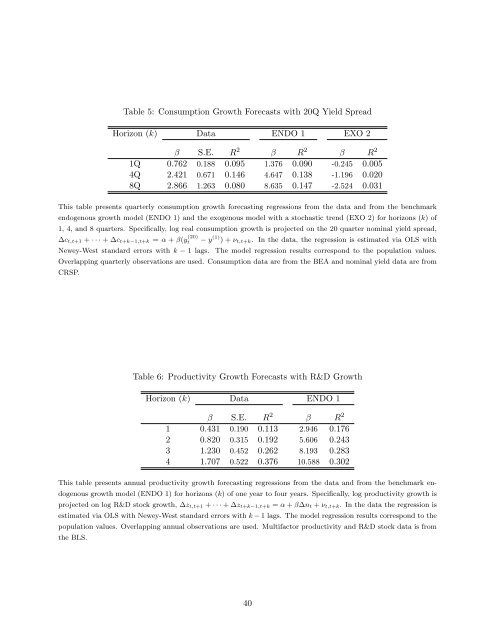
Table 5: Consumption <strong>Growth</strong> Forecasts with 20Q Yield Spread<br />
Horizon (k) Data ENDO 1 EXO 2<br />
β S.E. R 2 β R 2 β R 2<br />
1Q 0.762 0.188 0.095 1.376 0.090 -0.245 0.005<br />
4Q 2.421 0.671 0.146 4.647 0.138 -1.196 0.020<br />
8Q 2.866 1.263 0.080 8.635 0.147 -2.524 0.031<br />
This table presents quarterly consumption growth forecasting regressions from the data <strong>and</strong> from the benchmark<br />
endogenous growth model (ENDO 1) <strong>and</strong> the exogenous model with a stochastic trend (EXO 2) for horizons (k) of<br />
1, 4, <strong>and</strong> 8 quarters. Specifically, log real consumption growth is projected on the 20 quarter nominal yield spread,<br />
∆ct,t+1 + · · · + ∆ct+k−1,t+k = α + β(y (20)<br />
t − y (1) ) + νt,t+k. In the data, the regression is estimated via OLS with<br />
Newey-West st<strong>and</strong>ard errors with k − 1 lags. The model regression results correspond to the population values.<br />
Overlapping quarterly observations are used. Consumption data are from the BEA <strong>and</strong> nominal yield data are from<br />
CRSP.<br />
Table 6: Productivity <strong>Growth</strong> Forecasts with R&D <strong>Growth</strong><br />
Horizon (k) Data ENDO 1<br />
β S.E. R 2 β R 2<br />
1 0.431 0.190 0.113 2.946 0.176<br />
2 0.820 0.315 0.192 5.606 0.243<br />
3 1.230 0.452 0.262 8.193 0.283<br />
4 1.707 0.522 0.376 10.588 0.302<br />
This table presents annual productivity growth forecasting regressions from the data <strong>and</strong> from the benchmark en-<br />
dogenous growth model (ENDO 1) for horizons (k) of one year to four years. Specifically, log productivity growth is<br />
projected on log R&D stock growth, ∆zt,t+1 + · · · + ∆zt+k−1,t+k = α + β∆nt + νt,t+k. In the data the regression is<br />
estimated via OLS with Newey-West st<strong>and</strong>ard errors with k − 1 lags. The model regression results correspond to the<br />
population values. Overlapping annual observations are used. Multifactor productivity <strong>and</strong> R&D stock data is from<br />
the BLS.<br />
40