Equilibrium Growth, Inflation, and Bond Yields - Duke University's ...
Equilibrium Growth, Inflation, and Bond Yields - Duke University's ...
Equilibrium Growth, Inflation, and Bond Yields - Duke University's ...

Create successful ePaper yourself
Turn your PDF publications into a flip-book with our unique Google optimized e-Paper software.
! n<br />
! c<br />
0.02<br />
0.01<br />
0<br />
−0.01<br />
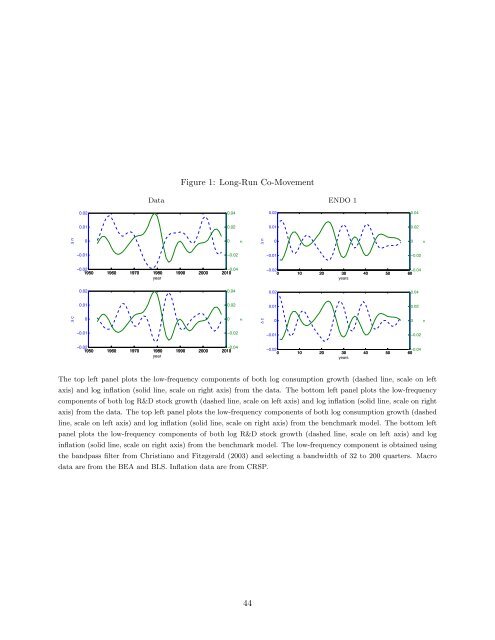
Figure 1: Long-Run Co-Movement<br />
Data ENDO 1<br />
0.04<br />
0.02<br />
−0.02<br />
−0.02<br />
1950 1960 1970 1980<br />
year<br />
1990 2000 2010<br />
−0.04<br />
0.02<br />
0.01<br />
0<br />
−0.01<br />
−0.02<br />
1950 1960 1970 1980<br />
year<br />
1990 2000 2010<br />
−0.04<br />
0<br />
0.04<br />
0.02<br />
0<br />
−0.02<br />
"<br />
"<br />
! n<br />
0.02<br />
0.01<br />
0<br />
−0.01<br />
−0.02<br />
−0.02<br />
0 10 20 30<br />
years<br />
40 50 60 −0.04<br />
−0.02<br />
0 10 20 30<br />
years<br />
40 50 60 −0.04<br />
The top left panel plots the low-frequency components of both log consumption growth (dashed line, scale on left<br />
axis) <strong>and</strong> log inflation (solid line, scale on right axis) from the data. The bottom left panel plots the low-frequency<br />
components of both log R&D stock growth (dashed line, scale on left axis) <strong>and</strong> log inflation (solid line, scale on right<br />
axis) from the data. The top left panel plots the low-frequency components of both log consumption growth (dashed<br />
line, scale on left axis) <strong>and</strong> log inflation (solid line, scale on right axis) from the benchmark model. The bottom left<br />
panel plots the low-frequency components of both log R&D stock growth (dashed line, scale on left axis) <strong>and</strong> log<br />
inflation (solid line, scale on right axis) from the benchmark model. The low-frequency component is obtained using<br />
the b<strong>and</strong>pass filter from Christiano <strong>and</strong> Fitzgerald (2003) <strong>and</strong> selecting a b<strong>and</strong>width of 32 to 200 quarters. Macro<br />
data are from the BEA <strong>and</strong> BLS. <strong>Inflation</strong> data are from CRSP.<br />
44<br />
! c<br />
0.02<br />
0.01<br />
0<br />
−0.01<br />
0.04<br />
0.02<br />
0<br />
0.04<br />
0.02<br />
0<br />
−0.02<br />
"<br />
"