Untitled - China Europe International Business School
Untitled - China Europe International Business School
Untitled - China Europe International Business School

Create successful ePaper yourself
Turn your PDF publications into a flip-book with our unique Google optimized e-Paper software.
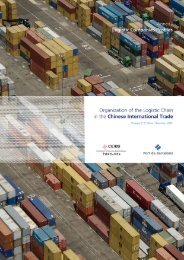
Organization of the logistic chain in the Chinese international trade<br />
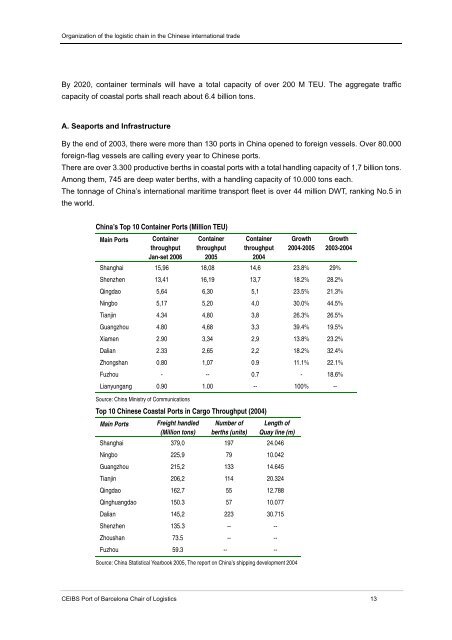
By 2020, container terminals will have a total capacity of over 200 M TEU. The aggregate traffic<br />
capacity of coastal ports shall reach about 6.4 billion tons.<br />
A. Seaports and Infrastructure<br />
By the end of 2003, there were more than 130 ports in <strong>China</strong> opened to foreign vessels. Over 80.000<br />
foreign-flag vessels are calling every year to Chinese ports.<br />
There are over 3.300 productive berths in coastal ports with a total handling capacity of 1,7 billion tons.<br />
Among them, 745 are deep water berths, with a handling capacity of 10.000 tons each.<br />
The tonnage of <strong>China</strong>’s international maritime transport fleet is over 44 million DWT, ranking No.5 in<br />
the world.<br />
<strong>China</strong>’s Top 10 Container Ports (Million TEU)<br />
Main Ports<br />
Container<br />
throughput<br />
Jan-set 2006<br />
Container<br />
throughput<br />
2005<br />
Container<br />
throughput<br />
2004<br />
Growth<br />
2004-2005<br />
Growth<br />
2003-2004<br />
Shanghai 15,96 18,08 14,6 23.8% 29%<br />
Shenzhen 13,41 16,19 13,7 18.2% 28.2%<br />
Qingdao 5,64 6,30 5,1 23.5% 21.3%<br />
Ningbo 5,17 5,20 4,0 30.0% 44.5%<br />
Tianjin 4.34 4,80 3,8 26.3% 26.5%<br />
Guangzhou 4.80 4,68 3,3 39.4% 19.5%<br />
Xiamen 2.90 3,34 2,9 13.8% 23.2%<br />
Dalian 2.33 2,65 2,2 18.2% 32.4%<br />
Zhongshan 0.80 1,07 0.9 11.1% 22.1%<br />
Fuzhou - -- 0.7 - 18.6%<br />
Lianyungang 0.90 1.00 -- 100% --<br />
Source: <strong>China</strong> Ministry of Communications<br />
Top 10 Chinese Coastal Ports in Cargo Throughput (2004)<br />
Main Ports Freight handled Number of Length of<br />
(Million tons) berths (units) Quay line (m)<br />
Shanghai 379,0 197 24.046<br />
Ningbo 225,9 79 10.042<br />
Guangzhou 215,2 133 14.645<br />
Tianjin 206,2 114 20.324<br />
Qingdao 162,7 55 12.788<br />
Qinghuangdao 150.3 57 10.077<br />
Dalian 145,2 223 30.715<br />
Shenzhen 135.3 -- --<br />
Zhoushan 73.5 -- --<br />
Fuzhou 59.3 -- --<br />
Source: <strong>China</strong> Statistical Yearbook 2005, The report on <strong>China</strong>’s shipping development 2004<br />
CEIBS Port of Barcelona Chair of Logistics 13