Untitled - China Europe International Business School
Untitled - China Europe International Business School
Untitled - China Europe International Business School

Create successful ePaper yourself
Turn your PDF publications into a flip-book with our unique Google optimized e-Paper software.
Organization of the logistic chain in the Chinese international trade<br />
Western Med. Ports<br />
Eastern Med. Ports<br />
Valencia 142.442 202.625 294.384 42% 45%<br />
Barcelona 87.676 135.776 159.095 55% 17%<br />
Algeciras 36.057 26.114 71.849 -- --<br />
Marseille 35.034 54.039 67.825 54% 26%<br />
Genoa 98.700 23.944 55.753 -76% 133%<br />
La Spezia 37.275 18.813 31.927 -50% 70%<br />
Napoli 4.399 16.636 15.747 278% -5%<br />
Gioia Tauro 20.222 7.541 10.115 -63% 34%<br />
Taranto (IT) 24.064 118.316 97.166 392% -18%<br />
Piraeus 84.188 88.290 93.024 5% 5%<br />
Thessaloniki 231 16.480 38.580 7034% 134%<br />
Trieste 2.802 17.994 24.777 542% 38%<br />
Source: Eurostat.<br />
Note*: Data from Zeebrugge in 2004 is not complete.<br />
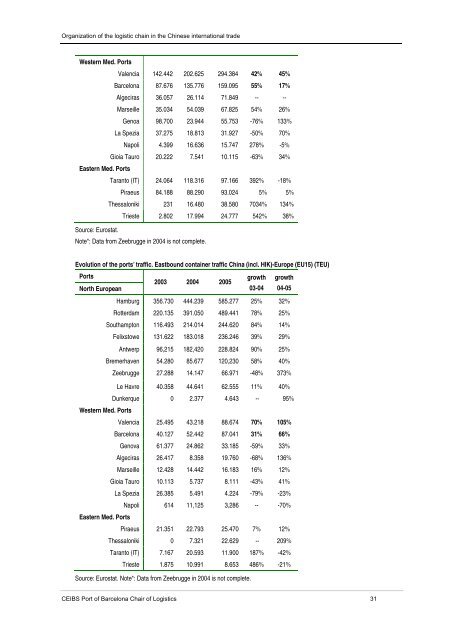
Evolution of the ports’ traffic. Eastbound container traffic <strong>China</strong> (incl. HIK)-<strong>Europe</strong> (EU15) (TEU)<br />
Ports<br />
North <strong>Europe</strong>an<br />
2003 2004 2005<br />
growth<br />
03-04<br />
growth<br />
04-05<br />
Hamburg 356.730 444.239 585.277 25% 32%<br />
Rotterdam 220.135 391.050 489.441 78% 25%<br />
Southampton 116.493 214.014 244.620 84% 14%<br />
Felixstowe 131.622 183.018 236.246 39% 29%<br />
Antwerp 96,215 182,420 228.824 90% 25%<br />
Bremerhaven 54.280 85.677 120,230 58% 40%<br />
Zeebrugge 27.288 14.147 66.971 -48% 373%<br />
Le Havre 40.358 44.641 62.555 11% 40%<br />
Dunkerque<br />
Western Med. Ports<br />
0 2.377 4.643 -- 95%<br />
Valencia 25.495 43.218 88.674 70% 105%<br />
Barcelona 40.127 52.442 87.041 31% 66%<br />
Genova 61.377 24.862 33.185 -59% 33%<br />
Algeciras 26.417 8.358 19.760 -68% 136%<br />
Marseille 12.428 14.442 16.183 16% 12%<br />
Gioia Tauro 10.113 5.737 8.111 -43% 41%<br />
La Spezia 26.385 5.491 4.224 -79% -23%<br />
Napoli<br />
Eastern Med. Ports<br />
614 11,125 3,286 -- -70%<br />
Piraeus 21.351 22.793 25.470 7% 12%<br />
Thessaloniki 0 7.321 22.629 -- 209%<br />
Taranto (IT) 7.167 20.593 11.900 187% -42%<br />
Trieste 1.875 10.991 8.653 486% -21%<br />
Source: Eurostat. Note*: Data from Zeebrugge in 2004 is not complete.<br />
CEIBS Port of Barcelona Chair of Logistics 31