Untitled - China Europe International Business School
Untitled - China Europe International Business School
Untitled - China Europe International Business School

You also want an ePaper? Increase the reach of your titles
YUMPU automatically turns print PDFs into web optimized ePapers that Google loves.
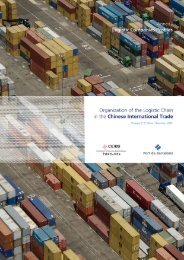
Organization of the logistic chain in the Chinese international trade<br />
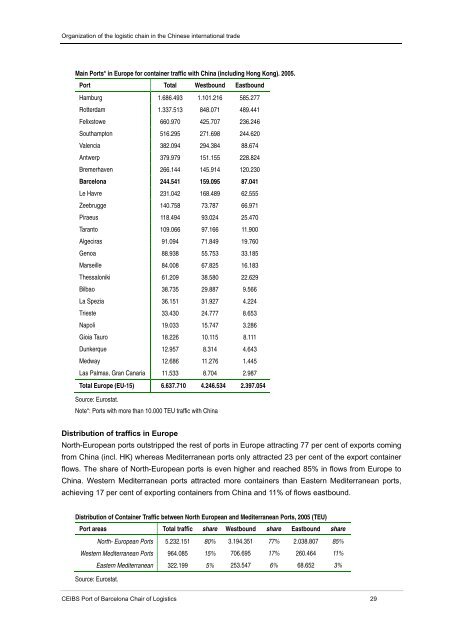
Main Ports* in <strong>Europe</strong> for container traffic with <strong>China</strong> (including Hong Kong). 2005.<br />
Port Total Westbound Eastbound<br />
Hamburg 1.686.493 1.101.216 585.277<br />
Rotterdam 1.337.513 848.071 489.441<br />
Felixstowe 660.970 425.707 236.246<br />
Southampton 516.295 271.698 244.620<br />
Valencia 382.094 294.384 88.674<br />
Antwerp 379.979 151.155 228.824<br />
Bremerhaven 266.144 145.914 120.230<br />
Barcelona 244.541 159.095 87.041<br />
Le Havre 231.042 168.489 62.555<br />
Zeebrugge 140.758 73.787 66.971<br />
Piraeus 118.494 93.024 25.470<br />
Taranto 109.066 97.166 11.900<br />
Algeciras 91.094 71.849 19.760<br />
Genoa 88.938 55.753 33.185<br />
Marseille 84.008 67.825 16.183<br />
Thessaloniki 61.209 38.580 22.629<br />
Bilbao 38.735 29.887 9.566<br />
La Spezia 36.151 31.927 4.224<br />
Trieste 33.430 24.777 8.653<br />
Napoli 19.033 15.747 3.286<br />
Gioia Tauro 18.226 10.115 8.111<br />
Dunkerque 12.957 8.314 4.643<br />
Medway 12.686 11.276 1.445<br />
Las Palmas, Gran Canaria 11.533 8.704 2.987<br />
Total <strong>Europe</strong> (EU-15) 6.637.710 4.246.534 2.397.054<br />
Source: Eurostat.<br />
Note*: Ports with more than 10.000 TEU traffic with <strong>China</strong><br />
Distribution of traffics in <strong>Europe</strong><br />
North-<strong>Europe</strong>an ports outstripped the rest of ports in <strong>Europe</strong> attracting 77 per cent of exports coming<br />
from <strong>China</strong> (incl. HK) whereas Mediterranean ports only attracted 23 per cent of the export container<br />
flows. The share of North-<strong>Europe</strong>an ports is even higher and reached 85% in flows from <strong>Europe</strong> to<br />
<strong>China</strong>. Western Mediterranean ports attracted more containers than Eastern Mediterranean ports,<br />
achieving 17 per cent of exporting containers from <strong>China</strong> and 11% of flows eastbound.<br />
Distribution of Container Traffic between North <strong>Europe</strong>an and Mediterranean Ports, 2005 (TEU)<br />
Port areas Total traffic share Westbound share Eastbound share<br />
North- <strong>Europe</strong>an Ports 5.232.151 80% 3.194.351 77% 2.038.807 85%<br />
Western Mediterranean Ports 964.085 15% 706.695 17% 260.464 11%<br />
Eastern Mediterranean 322.199 5% 253.547 6% 68.652 3%<br />
Source: Eurostat.<br />
CEIBS Port of Barcelona Chair of Logistics 29