- Page 1 and 2:
Lebenswissenschaften Life Sciences
- Page 4 and 5:
Forschungszentrum Jülich GmbH Inst
- Page 6:
’Therefore, mathematical modeling
- Page 9 and 10:
Contents 3.4. Application: L-Valine
- Page 11 and 12:
Contents 4
- Page 13 and 14:
1. Introduction need for improved m
- Page 15 and 16:
2. Theory In a batch process, all s
- Page 17 and 18:
2. Theory 1997; Goncalves et al., 2
- Page 19 and 20:
2. Theory For batch fermentations,
- Page 21 and 22:
2. Theory with Yps being the yield
- Page 23 and 24:
2. Theory Inhibition Some catalytic
- Page 25 and 26:
2. Theory The method of least squar
- Page 27 and 28:
2. Theory evaluation can be made by
- Page 29 and 30:
2. Theory We define the measured or
- Page 31 and 32:
2. Theory build in the model. An ob
- Page 33 and 34:
2. Theory nations, the researcher i
- Page 35 and 36:
2. Theory W = J · Covθ · J T (2.
- Page 37 and 38:
2. Theory arg max ξ � m� m�
- Page 39 and 40:
2. Theory with all measured values
- Page 41 and 42:
2. Theory which can be estimated us
- Page 43 and 44:
2. Theory One option to account for
- Page 45 and 46:
2. Theory θ 2 $θ 2 0 area ≅ det
- Page 47 and 48:
2. Theory designed using a paramete
- Page 49 and 50:
2. Theory proteome14 (Hermann et al
- Page 51 and 52:
2. Theory 44
- Page 53 and 54:
3. Dynamic Modeling Framework itera
- Page 55 and 56:
3. Dynamic Modeling Framework 3.3.
- Page 57 and 58:
3. Dynamic Modeling Framework 3.3.3
- Page 59 and 60:
3. Dynamic Modeling Framework 52 du
- Page 61 and 62:
3. Dynamic Modeling Framework the c
- Page 63 and 64: 3. Dynamic Modeling Framework For d
- Page 65 and 66: 3. Dynamic Modeling Framework subse
- Page 67 and 68: 3. Dynamic Modeling Framework 60
- Page 69 and 70: 4. Simulative Comparison of Model D
- Page 71 and 72: 4. Simulative Comparison of Model D
- Page 73 and 74: 4. Simulative Comparison of Model D
- Page 75 and 76: 4. Simulative Comparison of Model D
- Page 77 and 78: 4. Simulative Comparison of Model D
- Page 79 and 80: 4. Simulative Comparison of Model D
- Page 81 and 82: 4. Simulative Comparison of Model D
- Page 83 and 84: 4. Simulative Comparison of Model D
- Page 85 and 86: 4. Simulative Comparison of Model D
- Page 87 and 88: 4. Simulative Comparison of Model D
- Page 89 and 90: 4. Simulative Comparison of Model D
- Page 91 and 92: 4. Simulative Comparison of Model D
- Page 93 and 94: 4. Simulative Comparison of Model D
- Page 95 and 96: 5. L-Valine Production Process Deve
- Page 97 and 98: 5. L-Valine Production Process Deve
- Page 99 and 100: 5. L-Valine Production Process Deve
- Page 101 and 102: 5. L-Valine Production Process Deve
- Page 103 and 104: 5. L-Valine Production Process Deve
- Page 105 and 106: 5. L-Valine Production Process Deve
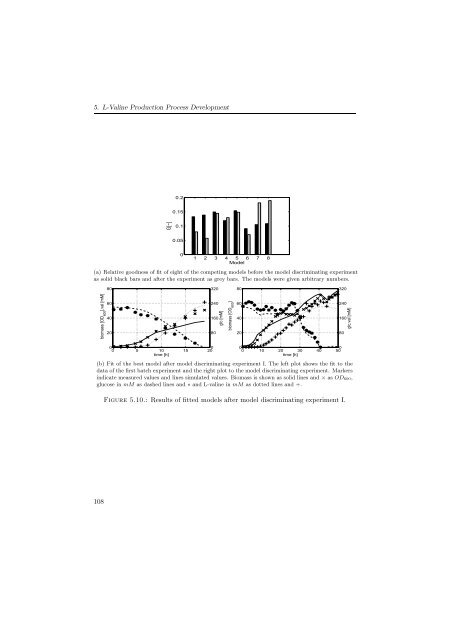
- Page 107 and 108: 5. L-Valine Production Process Deve
- Page 109 and 110: 5. L-Valine Production Process Deve
- Page 111 and 112: 5. L-Valine Production Process Deve
- Page 113: 5. L-Valine Production Process Deve
- Page 117 and 118: 5. L-Valine Production Process Deve
- Page 119 and 120: 5. L-Valine Production Process Deve
- Page 121 and 122: 5. L-Valine Production Process Deve
- Page 123 and 124: 5. L-Valine Production Process Deve
- Page 125 and 126: 5. L-Valine Production Process Deve
- Page 127 and 128: 5. L-Valine Production Process Deve
- Page 129 and 130: 5. L-Valine Production Process Deve
- Page 131 and 132: 5. L-Valine Production Process Deve
- Page 133 and 134: 5. L-Valine Production Process Deve
- Page 135 and 136: 5. L-Valine Production Process Deve
- Page 137 and 138: 5. L-Valine Production Process Deve
- Page 140 and 141: A. Nomenclature Table A.1.: Symbols
- Page 142 and 143: Table A.1.: Symbols and Abbreviatio
- Page 144 and 145: Table A.1.: Symbols and Abbreviatio
- Page 146 and 147: B. Ratio between OD600 and Dry Weig
- Page 148 and 149: C. The Influence of the Oxygen Supp
- Page 150 and 151: The measurements of amino acids and
- Page 152 and 153: kiv [mM] lac [mM] 15 10 5 0 0 10 20
- Page 154 and 155: OTR, CTR 0.06 0.04 0.02 0 0 10 20 3
- Page 156 and 157: DO properly at a low value in dynam
- Page 158 and 159: D. Dilution for Measurement of Amin
- Page 160 and 161: E. Models used in the First Model D
- Page 162 and 163: Model 1.6 Model 1.6 is similar to m
- Page 164 and 165:
Table E.1: Model Parameters of the
- Page 166 and 167:
Table E.2: Model Parameters of the
- Page 168 and 169:
161
- Page 170 and 171:
Model 2.2 Model 2.2 is similar to m
- Page 172 and 173:
Table F.1.: Model Parameters of the
- Page 174 and 175:
Table F.2.: Estimated Lag-Times of
- Page 176 and 177:
Table F.3: Model Parameters of the
- Page 178 and 179:
Table F.4.: Estimated Lag-Times of
- Page 180 and 181:
G. Alternative Off-line Optimized P
- Page 182 and 183:
G.2. Overall Yield of Product on Su
- Page 184 and 185:
Summary Fast development of product
- Page 186 and 187:
Zusammenfassung Es ist wichtig, die
- Page 188 and 189:
Acknowledgements This thesis result
- Page 190 and 191:
Bibliography K. Akashi, H. Shibai,
- Page 192 and 193:
Bibliography A. Bodalo-Santoyo, J.L
- Page 194 and 195:
Bibliography A.J. Cooper, J.Z. Gino
- Page 196 and 197:
Bibliography A.G. Fredrickson, R.D.
- Page 198 and 199:
Bibliography W.G. Hunter and A.M. R
- Page 200 and 201:
Bibliography A.C. McHardy, A. Tauch
- Page 202 and 203:
Bibliography E. Radmacher, A. Vaits
- Page 204 and 205:
Bibliography K.J. Versyck, J.E. Cla
- Page 206 and 207:
6FKULIWHQ GHV )RUVFKXQJV]HQWUXPV -
- Page 208 and 209:
6FKULIWHQ GHV )RUVFKXQJV]HQWUXPV -