

Corynebacterium glutamicum - JUWEL - Forschungszentrum Jülich
Corynebacterium glutamicum - JUWEL - Forschungszentrum Jülich
Corynebacterium glutamicum - JUWEL - Forschungszentrum Jülich

Create successful ePaper yourself
Turn your PDF publications into a flip-book with our unique Google optimized e-Paper software.
2.5. Experimental Design<br />
The squared brackets are added around the timing dependent covariance matrix of the<br />
values from the first sample Σi,t(1) to the last of ns samples Σi,t(ns), to emphasize the<br />
fact that these are [nv × nv] matrices taken from equation 2.67 and not just scalars.<br />
Now, this matrix can simply be added to the corresponding covariance matrix Σi,m,<br />
caused by measurement errors such as dilution inaccuracy or the accuracy of the used<br />
analytic equipment<br />
(2.70)<br />
Σi = Σi,m + Σi,t<br />
and used in the criterion formulated in equation 2.53 and 2.55.<br />
Obviously, when the measurement variance would be determined from replication of<br />
complete experiments, this part of the measurement error, caused by timing of the<br />
sampling, would be included in the measurement variance. This would, however, not<br />
be the case when the measurement variance would be determined solely based on the<br />
accuracy of the analytical methods or repeated measurement from one sample.<br />
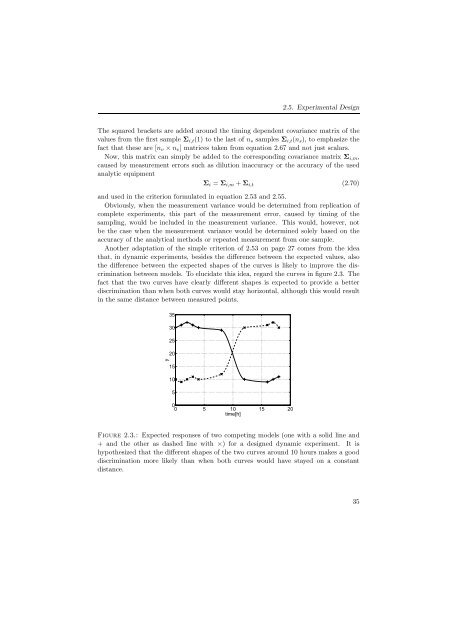
Another adaptation of the simple criterion of 2.53 on page 27 comes from the idea<br />
that, in dynamic experiments, besides the difference between the expected values, also<br />
the difference between the expected shapes of the curves is likely to improve the discrimination<br />
between models. To elucidate this idea, regard the curves in figure 2.3. The<br />
fact that the two curves have clearly different shapes is expected to provide a better<br />
discrimination than when both curves would stay horizontal, although this would result<br />
in the same distance between measured points.<br />
y<br />
35<br />
30<br />
25<br />
20<br />
15<br />
10<br />
5<br />
0<br />
0 5 10 15 20<br />
time[h]<br />
Figure 2.3.: Expected responses of two competing models (one with a solid line and<br />
+ and the other as dashed line with ×) for a designed dynamic experiment. It is<br />
hypothesized that the different shapes of the two curves around 10 hours makes a good<br />
discrimination more likely than when both curves would have stayed on a constant<br />
distance.<br />
35


