transporte de solutos en el flujo de agua en riego por surcos - Helvia ...
transporte de solutos en el flujo de agua en riego por surcos - Helvia ...
transporte de solutos en el flujo de agua en riego por surcos - Helvia ...

You also want an ePaper? Increase the reach of your titles
YUMPU automatically turns print PDFs into web optimized ePapers that Google loves.
5. Transfer<strong>en</strong>cia <strong>de</strong> <strong>solutos</strong> <strong>de</strong>s<strong>de</strong> <strong>el</strong> su<strong>el</strong>o al <strong>flujo</strong> superficial <strong>de</strong> <strong>agua</strong><br />
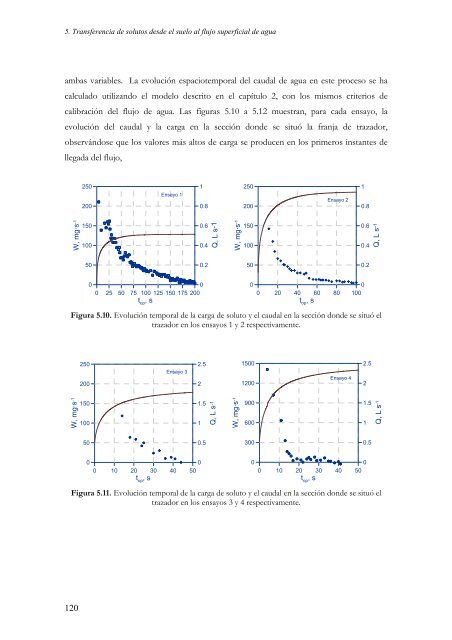
ambas variables. La evolución espaciotem<strong>por</strong>al <strong>de</strong>l caudal <strong>de</strong> <strong>agua</strong> <strong>en</strong> este proceso se ha<br />
calculado utilizando <strong>el</strong> mo<strong>de</strong>lo <strong>de</strong>scrito <strong>en</strong> <strong>el</strong> capítulo 2, con los mismos criterios <strong>de</strong><br />
calibración <strong>de</strong>l <strong>flujo</strong> <strong>de</strong> <strong>agua</strong>. Las figuras 5.10 a 5.12 muestran, para cada <strong>en</strong>sayo, la<br />
evolución <strong>de</strong>l caudal y la carga <strong>en</strong> la sección don<strong>de</strong> se situó la franja <strong>de</strong> trazador,<br />
observándose que los valores más altos <strong>de</strong> carga se produc<strong>en</strong> <strong>en</strong> los primeros instantes <strong>de</strong><br />
llegada <strong>de</strong>l <strong>flujo</strong>,<br />
W, mg·s -1<br />
120<br />
250<br />
200<br />
150<br />
100<br />
50<br />
0<br />
Ensayo 1<br />
0 25 50<br />
0<br />
75 100 125 150 175 200<br />
top , s<br />
1<br />
0.8<br />
0.6<br />
0.4<br />
0.2<br />
Q, L s-1<br />
W, mg·s -1<br />
250<br />
200<br />
150<br />
100<br />
50<br />
0<br />
Ensayo 2<br />
0 20 40 60 80<br />
0<br />
100<br />
top , s<br />
Figura 5.10. Evolución tem<strong>por</strong>al <strong>de</strong> la carga <strong>de</strong> soluto y <strong>el</strong> caudal <strong>en</strong> la sección don<strong>de</strong> se situó <strong>el</strong><br />
trazador <strong>en</strong> los <strong>en</strong>sayos 1 y 2 respectivam<strong>en</strong>te.<br />
W, mg·s -1<br />
250<br />
200<br />
150<br />
100<br />
50<br />
0<br />
Ensayo 3<br />
0 10 20 30 40 50<br />
t op , s<br />
2.5<br />
2<br />
1.5<br />
1<br />
0.5<br />
0<br />
Q, L s -1<br />
W, mg·s -1<br />
1500<br />
1200<br />
900<br />
600<br />
300<br />
0<br />
Ensayo 4<br />
0 10 20 30 40 50<br />
t op , s<br />
Figura 5.11. Evolución tem<strong>por</strong>al <strong>de</strong> la carga <strong>de</strong> soluto y <strong>el</strong> caudal <strong>en</strong> la sección don<strong>de</strong> se situó <strong>el</strong><br />
trazador <strong>en</strong> los <strong>en</strong>sayos 3 y 4 respectivam<strong>en</strong>te.<br />
1<br />
0.8<br />
0.6<br />
0.4<br />
0.2<br />
2.5<br />
2<br />
1.5<br />
1<br />
0.5<br />
0<br />
Q, L s -1<br />
Q, L s -1