Viento y Sol: Aprovechando los regalos de la Naturaleza
Viento y Sol: Aprovechando los regalos de la Naturaleza
Viento y Sol: Aprovechando los regalos de la Naturaleza

You also want an ePaper? Increase the reach of your titles
YUMPU automatically turns print PDFs into web optimized ePapers that Google loves.
20<br />
35,000<br />
30,000<br />
25,000<br />
20,000<br />
15,000<br />
10,000<br />
5,000<br />
-<br />
Nov09<br />
2008<br />
2007<br />
2006<br />
2005<br />
2004<br />
2003<br />
2002<br />
2001<br />
2000<br />
29,043<br />
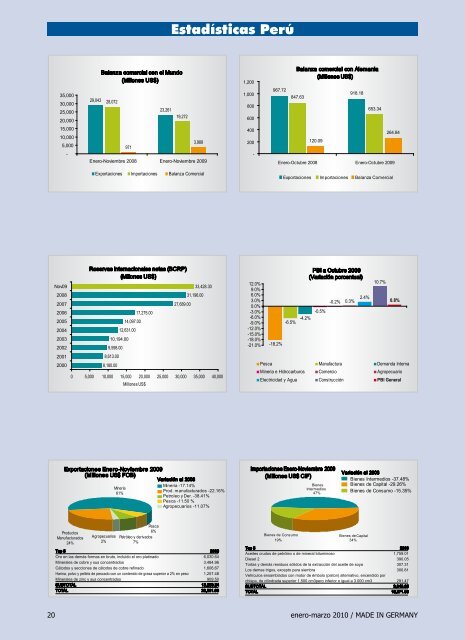
Ba<strong>la</strong>nza comercial con el Mundo<br />
(Millones US$)<br />
28,072<br />
971<br />
23,261<br />
Estadísticas Perú<br />
19,272<br />
3,989<br />
Enero-Noviembre 2008 Enero-Noviembre 2009<br />
Exportaciones Importaciones Ba<strong>la</strong>nza Comercial<br />
Reservas internacionales netas (BCRP)<br />
(Millones US$)<br />
10,194.00<br />
9,598.00<br />
8,613.00<br />
8,180.00<br />
14,097.00<br />
12,631.00<br />
17,275.00<br />
27,689.00<br />
33,428.30<br />
31,196.00<br />
0 5,000 10,000 15,000 20,000 25,000 30,000 35,000 40,000<br />
Millones US$<br />
Exportaciones Enero-Noviembre 2009<br />
(Millones US$ FOB)<br />
Variación al 2008<br />
Minería -17.14%<br />
Mineria<br />
Prod. manufacturados -22.16%<br />
61%<br />
Petroleo y Der. -38.41%<br />
Pesca -11.50 %<br />
Agropecuarios -11.07%<br />
Productos<br />
Manufacturados<br />
24%<br />
Agropecuarios<br />
2%<br />
Pesca<br />
6%<br />
Petróleo y <strong>de</strong>rivados<br />
7%<br />
Top 5 2009<br />
Oro en <strong>la</strong>s <strong>de</strong>más formas en bruto, incluido el oro p<strong>la</strong>tinado 6,030.64<br />
Minerales <strong>de</strong> cobre y sus concentrados 3,484.96<br />
Cátodos y secciones <strong>de</strong> cátodos <strong>de</strong> cobre refinado 1,606.67<br />
Harina, polvo y pellets <strong>de</strong> pescado con un contenido <strong>de</strong> grasa superior a 2% en peso 1,257.48<br />
Minerales <strong>de</strong> zinc y sus concentrados 909.50<br />
SUBTOTAL 13,289.24<br />
TOTAL 23,261.08<br />
1,200<br />
1,000<br />
800<br />
600<br />
400<br />
200<br />
-<br />
12.0%<br />
9.0%<br />
6.0%<br />
3.0%<br />
0.0%<br />
-3.0%<br />
-6.0%<br />
-9.0%<br />
-12.0%<br />
-15.0%<br />
-18.0%<br />
-21.0%<br />
967.72<br />
-18.2%<br />
Importaciones Enero-Noviembre 2009<br />
(Millones US$ CIF)<br />
Ba<strong>la</strong>nza comercial con Alemania<br />
(Millones US$)<br />
847.63<br />
120.09<br />
918.18<br />
653.34<br />
264.84<br />
Enero-Octubre 2008 Enero-Octubre 2009<br />
Exportaciones Importaciones Ba<strong>la</strong>nza Comercial<br />
-6.5% -4.2%<br />
PBI a Octubre 2009<br />
(Variación porcentual)<br />
-0.5%<br />
-0.2% 0.3% 2.4%<br />
10.7%<br />
0.8%<br />
Pesca Manufactura Demanda Interna<br />
Mineria e Hidrocarburos Comercio Agropecuario<br />
Electricidad y Agua Construcción PBI General<br />
Bienes <strong>de</strong> Consumo<br />
19%<br />
Bienes<br />
Intermedios<br />
47%<br />
Variación al 2008<br />
Bienes Intermedios -37.48%<br />
Bienes <strong>de</strong> Capital -29.26%<br />
Bienes <strong>de</strong> Consumo -15.35%<br />
Bienes <strong>de</strong> Capital<br />
34%<br />
Top 5 2009<br />
Aceites crudos <strong>de</strong> petróleo o <strong>de</strong> mineral bituminoso 1,759.01<br />
Diesel 2 390.05<br />
Tortas y <strong>de</strong>más residuos sólidos <strong>de</strong> <strong>la</strong> extracción <strong>de</strong>l aceite <strong>de</strong> soya 307.31<br />
Los <strong>de</strong>mas trigos, excepto para siembra 300.81<br />
Vehícu<strong>los</strong> ensamb<strong>la</strong>dos con motor <strong>de</strong> émbolo (piston) alternativo, encendido por<br />
chispa, <strong>de</strong> cilindrada superior 1.500 cm3pero inferior o igual a 3.000 cm3 291.47<br />
SUBTOTAL 3,048.65<br />
TOTAL 19,271.68<br />
enero-marzo 2010 / MADE IN GERMANY