Descargar - Universidad Autónoma del Estado de México
Descargar - Universidad Autónoma del Estado de México
Descargar - Universidad Autónoma del Estado de México

You also want an ePaper? Increase the reach of your titles
YUMPU automatically turns print PDFs into web optimized ePapers that Google loves.
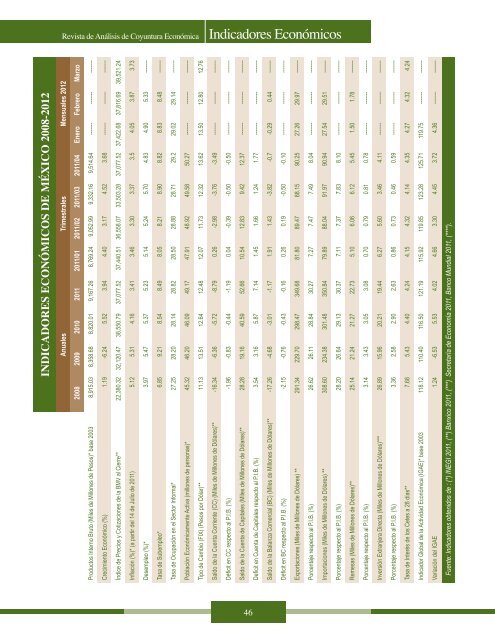
Revista <strong>de</strong> Análisis <strong>de</strong> Coyuntura Económica<br />
Indicadores Económicos<br />
INDICADORES ECONÓMICOS DE MÉXICO 2008-2012<br />
Anuales Trimestrales Mensuales 2012<br />
2008 2009 2010 2011 2011/01 2011/02 2011/03 2011/04 Enero Febrero Marzo<br />
Productos Interno Bruto (Miles <strong>de</strong> Millones <strong>de</strong> Pesos)* base 2003 8,915.03 8,358.68 8,820.01 9,167.26 8,769.24 9,052.99 9,332.16 9,514.64 ------- ------- -------<br />
Crecimiento Económico (%) 1.19 -6.24 5.52 3.94 4.40 3.17 4.52 3.68 ------- ------- -------<br />
Índice <strong>de</strong> Precios y Cotizaciones <strong>de</strong> la BMV al Cierre** 22,380.32 32,120.47 38,550.79 37,077.52 37,440.51 36,558.07 33,503.28 37,077.52 37,422.68 37,816.69 39,521.24<br />
Inflación (%)* (a partir <strong><strong>de</strong>l</strong> 14 <strong>de</strong> Julio <strong>de</strong> 2011) 5.12 5.31 4.16 3.41 3.46 3.30 3.37 3.5 4.05 3.87 3.73<br />
Desempleo (%)* 3.97 5.47 5.37 5.23 5.14 5.24 5.70 4.83 4.90 5.33 -------<br />
Tasa <strong>de</strong> Subempleo* 6.85 9.21 8.54 8.49 8.05 8.21 8.90 8.82 8.83 8.48 -------<br />
Tasa <strong>de</strong> Ocupación en el Sector Informal* 27.25 28.20 28.14 28.82 28.50 28.88 28.71 29.2 29.02 29.14 -------<br />
Población Económicamente Activa (millones <strong>de</strong> personas)* 45.32 46.20 46.09 49.17 47.91 48.92 49.58 50.27 ------- ------- -------<br />
Tipo <strong>de</strong> Cambio (FIX) (Pesos por Dólar)** 11.13 13.51 12.64 12.48 12.07 11.73 12.32 13.62 13.50 12.80 12.76<br />
Saldo <strong>de</strong> la Cuenta Corriente (CC) (Miles <strong>de</strong> Millones <strong>de</strong> Dólares)** -16.34 -6.36 -5.72 -8.79 0.26 -2.98 -3.76 -3.49 ------- ------- -------<br />
Déficit en CC respecto al P.I.B. (%) -1.96 -0.83 -0.44 -1.19 0.04 -0.39 -0.50 -0.50 ------- ------- -------<br />
Saldo <strong>de</strong> la Cuenta <strong>de</strong> Capitales (Miles <strong>de</strong> Millones <strong>de</strong> Dólares)** 28.28 19.16 40.59 52.66 10.54 12.83 9.42 12.37 ------- ------- -------<br />
Deficit en Cuenta <strong>de</strong> Capitales respecto al P.I.B. (%) 3.54 3.16 5.87 7.14 1.45 1.66 1.24 1.77 ------- ------- -------<br />
Saldo <strong>de</strong> la Balanza Comercial (BC) (Miles <strong>de</strong> Millones <strong>de</strong> Dólares)** -17.26 -4.68 -3.01 -1.17 1.91 1.43 -3.82 -0.7 -0.29 0.44 -------<br />
Déficit en BC respecto al P.I.B. (%) -2.15 -0.76 -0.43 -0.16 0.26 0.19 -0.50 -0.10 ------- ------- -------<br />
Exportaciones (Miles <strong>de</strong> Millones <strong>de</strong> Dólares) ** 291.34 229.70 298.47 349.68 81.80 89.47 88.15 90.25 27.26 29.97 -------<br />
Porcentaje respecto al P.I.B. (%) 26.62 26.11 28.84 30.27 7.27 7.47 7.49 8.04 ------- ------- -------<br />
Importaciones (Miles <strong>de</strong> Millones <strong>de</strong> Dólares) ** 308.60 234.38 301.48 350.84 79.89 88.04 91.97 90.94 27.54 29.51 -------<br />
Porcentaje respecto al P.I.B. (%) 28.20 26.64 29.13 30.37 7.11 7.37 7.83 8.10 ------- ------- -------<br />
Remesas (Miles <strong>de</strong> Millones <strong>de</strong> Dólares)** 25.14 21.24 21.27 22.73 5.10 6.06 6.12 5.45 1.50 1.78 -------<br />
Porcentaje respecto al P.I.B. (%) 3.14 3.43 3.05 3.08 0.70 0.79 0.81 0.78 ------- ------- -------<br />
Inversión Extranjera Directa (Miles <strong>de</strong> Millones <strong>de</strong> Dólares)*** 26.89 15.96 20.21 19.44 6.27 5.60 3.46 4.11 ------- ------- -------<br />
Porcentaje respecto al P.I.B. (%) 3.36 2.58 2.90 2.63 0.86 0.73 0.46 0.59 ------- ------- -------<br />
Tasa <strong>de</strong> Interés <strong>de</strong> los Cetes a 28 días** 7.68 5.43 4.40 4.24 4.15 4.32 4.14 4.35 4.27 4.32 4.24<br />
Indicador Global <strong>de</strong> la Actividad Económica (IGAE)* base 2003 118.12 110.40 116.50 121.19 115.92 119.85 123.28 125.71 119.75 ------- -------<br />
Variación <strong><strong>de</strong>l</strong> IGAE 1.24 -6.53 5.53 4.02 4.66 3.30 4.45 3.72 4.36 ------- -------<br />
Fuente: Indicadores obtenidos <strong>de</strong> : (*) INEGI 2011, (**) Banxico 2011, (***) Secretaría <strong>de</strong> Economía 2011, Banco Mundial 2011, (****).<br />
46<br />
ECONOMIA 9MAYO.indd 46 09/05/12 09:46