Descargar - Universidad Autónoma del Estado de México
Descargar - Universidad Autónoma del Estado de México
Descargar - Universidad Autónoma del Estado de México

Create successful ePaper yourself
Turn your PDF publications into a flip-book with our unique Google optimized e-Paper software.
Indicadores Económicos<br />
Revista <strong>de</strong> Análisis <strong>de</strong> Coyuntura Económica<br />
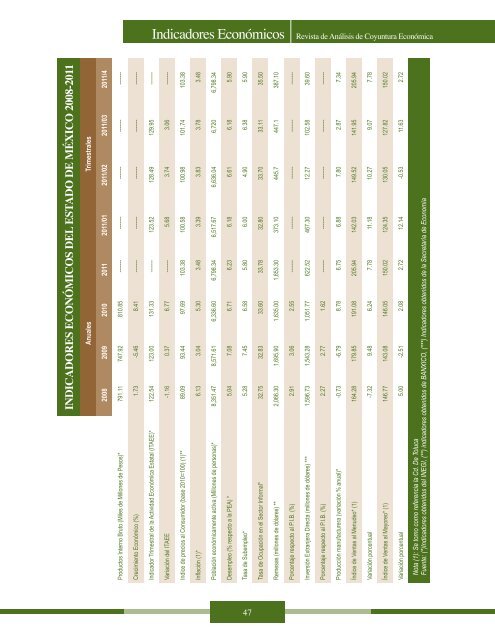
INDICADORES ECONÓMICOS DEL ESTADO DE MÉXICO 2008-2011<br />
Anuales Trimestrales<br />
2008 2009 2010 2011 2011/01 2011/02 2011/03 2011/4<br />
Productos Interno Bruto (Miles <strong>de</strong> Millones <strong>de</strong> Pesos)* 791.11 747.92 810.85 ------- ------- ------- ------- -------<br />
Crecimiento Económico (%) 1.73 -5.46 8.41 ------- ------- ------- ------- -------<br />
Indicador Trimestral <strong>de</strong> la Actividad Económica Estatal (ITAEE)* 122.54 123.00 131.33 ------- 123.52 128.49 129.95 -------<br />
Variación <strong><strong>de</strong>l</strong> ITAEE -1.16 0.37 6.77 ------- 5.68 3.74 3.06 -------<br />
Indice <strong>de</strong> precios al Consumidor (base 2010=100) (1)** 89.09 93.44 97.69 103.38 100.58 100.98 101.74 103.38<br />
Inflación (1)* 6.13 3.04 5.30 3.48 3.39 3.83 3.78 3.48<br />
Población económicamente activa (Millones <strong>de</strong> personas)* 8,351.47 8,571.61 6,336.60 6,798.34 6,517.67 6,636.04 6,720 6,798.34<br />
Desempleo (% respecto a la PEA) * 5.04 7.08 6.71 6.23 6.18 6.61 6.18 5.90<br />
Tasa <strong>de</strong> Subempleo* 5.28 7.45 6.58 5.80 6.00 4.90 6.38 5.90<br />
Tasa <strong>de</strong> Ocupación en el Sector Informal* 32.75 32.83 33.60 33.78 32.80 33.70 33.11 35.50<br />
Remesas (millones <strong>de</strong> dólares) ** 2,066.30 1,695.90 1,635.00 1,653.30 373.10 445.7 447.1 387.10<br />
Porcentaje respecto al P.I.B. (%) 2.91 3.06 2.55 ------- ------- ------- ------- -------<br />
Inversión Extranjera Directa (millones <strong>de</strong> dólares) *** 1,596.73 1,543.28 1,051.77 622.52 467.30 12.27 102.58 39.60<br />
Porcentaje respecto al P.I.B. (%) 2.27 2.77 1.62 ------- ------- ------- ------- -------<br />
Producción manufacturera (variación % anual)* -0.73 -6.79 8.78 6.75 6.88 7.80 2.87 7.34<br />
Índice <strong>de</strong> Ventas al Menu<strong>de</strong>o* (1) 164.28 179.85 191.08 205.94 142.03 149.52 141.95 205.94<br />
Variación porcentual -7.32 9.48 6.24 7.78 11.18 10.27 9.07 7.78<br />
Índice <strong>de</strong> Ventas al Mayoreo* (1) 146.77 143.08 146.05 150.02 124.35 130.05 127.82 150.02<br />
Variación porcentual 5.00 -2.51 2.08 2.72 12.14 -0.53 11.63 2.72<br />
Nota (1): Se tomo como referencia la Cd. De Toluca<br />
Fuente: (*)Indicadores obtenidos <strong><strong>de</strong>l</strong> INEGI, (**) indicadores obtenidos <strong>de</strong> BANXICO, (***) Indicadores obtenidos <strong>de</strong> la Secretaría <strong>de</strong> Economía<br />
47<br />
ECONOMIA 9MAYO.indd 47 09/05/12 09:46