ESTUDIO HIDROLÃGICO COMPLEMENTARIO
ESTUDIO HIDROLÃGICO COMPLEMENTARIO
ESTUDIO HIDROLÃGICO COMPLEMENTARIO
- No tags were found...

Create successful ePaper yourself
Turn your PDF publications into a flip-book with our unique Google optimized e-Paper software.
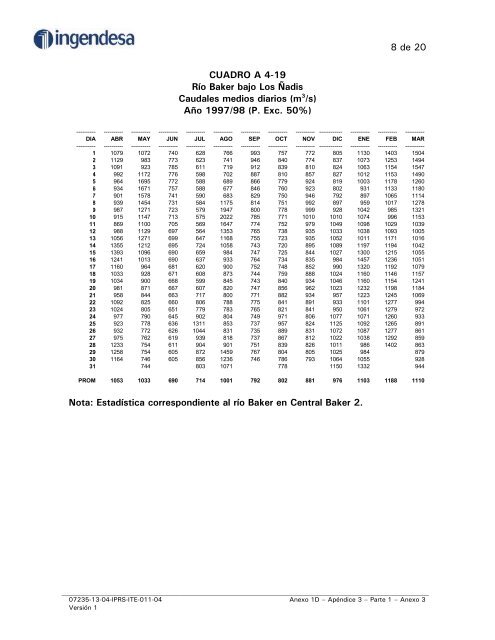
8 de 20CUADRO A 4-19Río Baker bajo Los ÑadisCaudales medios diarios (m 3 /s)Año 1997/98 (P. Exc. 50%)---------- ---------- ---------- ---------- ---------- ---------- ---------- ---------- ---------- ------------ ---------- ---------- ----------DIA ABR MAY JUN JUL AGO SEP OCT NOV DIC ENE FEB MAR---------- ---------- ---------- ---------- ---------- ---------- ---------- ---------- ---------- ------------ ---------- ---------- ----------1 1079 1072 740 628 766 993 757 772 805 1130 1403 15042 1129 983 773 623 741 946 840 774 837 1073 1253 14943 1091 923 785 611 719 912 839 810 824 1063 1154 15474 992 1172 776 598 702 887 810 857 827 1012 1153 14905 964 1695 772 588 689 866 779 924 819 1003 1178 12606 934 1671 757 588 677 846 760 923 802 931 1133 11807 901 1578 741 590 683 829 750 946 792 897 1065 11148 939 1454 731 584 1175 814 751 992 897 959 1017 12789 987 1271 723 579 1947 800 778 999 928 1042 985 132110 915 1147 713 575 2022 785 771 1010 1010 1074 996 115311 869 1100 705 569 1647 774 752 979 1049 1098 1029 103912 988 1129 697 564 1353 765 738 935 1033 1038 1093 100513 1056 1271 699 647 1168 755 723 935 1052 1011 1171 101614 1355 1212 695 724 1058 743 720 895 1089 1197 1194 104215 1393 1096 690 659 984 747 725 844 1027 1300 1215 105516 1241 1013 690 637 933 764 734 835 984 1457 1236 105117 1160 964 681 620 900 752 748 852 990 1320 1192 107918 1033 928 671 608 873 744 759 888 1024 1160 1146 115719 1034 900 668 599 845 743 840 934 1046 1160 1154 124120 981 871 667 607 820 747 856 962 1023 1232 1198 118421 958 844 663 717 800 771 882 934 957 1223 1245 106922 1092 825 660 806 788 775 841 891 933 1101 1277 99423 1024 805 651 779 783 765 821 841 950 1061 1279 97224 977 790 645 902 804 749 971 806 1077 1071 1260 93325 923 778 636 1311 853 737 957 824 1125 1092 1265 89126 932 772 626 1044 831 735 889 831 1072 1087 1277 86127 975 762 619 939 818 737 867 812 1022 1038 1292 85928 1233 754 611 904 901 751 839 826 1011 986 1402 86329 1258 754 605 872 1459 767 804 805 1025 984 87930 1164 746 605 856 1236 746 786 793 1064 1055 92831 744 803 1071 778 1150 1332 944PROM 1053 1033 690 714 1001 792 802 881 976 1103 1188 1110Nota: Estadística correspondiente al río Baker en Central Baker 2.__________________________________________________________________________________________________________________07235-13-04-IPRS-ITE-011-04 Anexo 1D – Apéndice 3 – Parte 1 – Anexo 3Versión 1