- Page 1 and 2:
ANEXO 1D, APÉNDICE 3, PARTE 1ESTUD
- Page 5 and 6:
2 de 101estimación de los caudales
- Page 7 and 8:
4 de 1013.2. Recopilación bibliogr
- Page 9 and 10:
6 de 1013.3.2. Zonas de Yacimientos
- Page 11 and 12:
8 de 101FIGURA 3.1-2CUENCA DEL RÍO
- Page 13 and 14:
10 de 101Chacabuco. Hacia aguas aba
- Page 15 and 16:
12 de 101Para conocer más sobre es
- Page 17 and 18:
14 de 101La estadística de caudale
- Page 19 and 20:
16 de 101En el Cuadro A4-3 del Anex
- Page 21 and 22:
18 de 101Los coeficientes de determ
- Page 23 and 24:
20 de 101Al igual que en las correl
- Page 25 and 26:
22 de 101- Río Pascua en Central P
- Page 27 and 28: 24 de 101A continuación se detalla
- Page 29 and 30: 26 de 1014.5.1. Recursos hídricos
- Page 31 and 32: 28 de 101FIGURA 4.5-1Central Baker
- Page 33 and 34: 30 de 101Cuadro 4.5-4Río Baker en
- Page 35 and 36: 32 de 101Cuadro 4.5-5Río Del Salto
- Page 37 and 38: 34 de 101FIGURA 4.5-3Central Del Sa
- Page 39 and 40: 36 de 101Cuadro 4.5-8Río Pascua en
- Page 41 and 42: 38 de 101Cuadro 4.5-9Río Pascua en
- Page 43 and 44: 40 de 101FIGURA 4.5-5Central Pascua
- Page 45 and 46: 42 de 101Cuadro 4.5-12Río Pascua e
- Page 47 and 48: 44 de 1014.5.1.2. Caudales medios d
- Page 49 and 50: 46 de 101Cuadro 4.5-14Río Maitén
- Page 51 and 52: 48 de 1015.2.2. Análisis de frecue
- Page 53 and 54: 50 de 101de frecuencia se muestra e
- Page 55 and 56: 52 de 101En esta estación las mayo
- Page 57 and 58: 54 de 101• Cuenca del río Pascua
- Page 59 and 60: 56 de 101instantáneos para períod
- Page 61 and 62: 58 de 101Pascua en Desagüe Lago O
- Page 63 and 64: 60 de 1015.3.1. Caudales de crecida
- Page 65 and 66: 62 de 101Tiempo(h)Cuadro 5.3-4Río
- Page 67 and 68: 64 de 101Tiempo(h)Tr= 1.000añosCua
- Page 69 and 70: 66 de 101Tiempo(h)Tr= 1.000añosCua
- Page 71 and 72: 68 de 101Cuadro 5.3-7Río Pascua en
- Page 73 and 74: 70 de 101Tiempo(h)Tr= 1.000añosCua
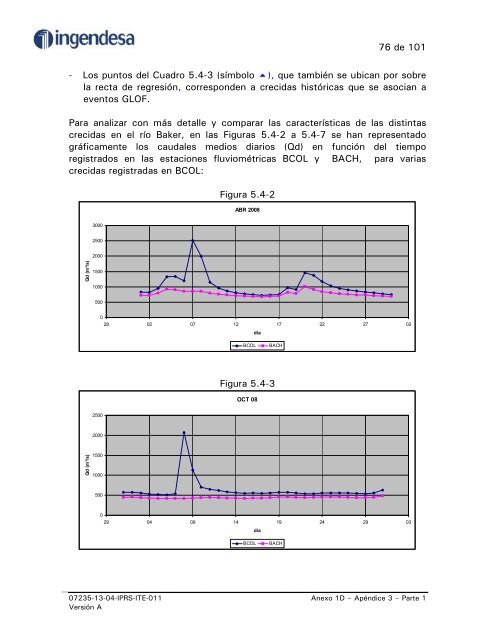
- Page 75 and 76: 72 de 1015.4. Análisis hidrológic
- Page 77: 74 de 101Cuadro 5.4-2Baker en Angos
- Page 81 and 82: 78 de 101Figura 5.4-6JUN 7725002000
- Page 83 and 84: 80 de 101Crecida Diciembre 2008BCOL
- Page 85 and 86: 82 de 101• El análisis de frecue
- Page 87 and 88: 84 de 101El U.S. Army Corps of Engi
- Page 89 and 90: 86 de 101- Presa Puclaro, embalse p
- Page 91 and 92: 88 de 101Al comparar estos coeficie
- Page 93 and 94: 90 de 101FIGURA 6.3-1Análisis de f
- Page 95 and 96: 92 de 101• Centrales en el río P
- Page 97 and 98: 94 de 101Figura 6.4-1Río Baker en
- Page 99 and 100: 96 de 101Figura 6.4-2Río Baker en
- Page 101 and 102: 98 de 101Figura 6.4-3Río Del Salto
- Page 103 and 104: 100 de 101Figura 6.4-4Río Pascua e
- Page 106 and 107: 1 de 17ANEXO 1RECURSOS HÍDRICOS___
- Page 108 and 109: 3 de 17CUADRO A4-2Río Baker en Ang
- Page 110 and 111: 5 de 17CUADRO A 4-4Río Chacabuco a
- Page 112 and 113: 7 de 17CUADRO A 4-6Río Del Salto a
- Page 114 and 115: 9 de 17CUADRO A 4-8Río Santa Cruz
- Page 116 and 117: 11 de 17CUADRO A 4-10Río Pascua an
- Page 118 and 119: 13 de 17FIGURA A 4-1Río Baker en a
- Page 120 and 121: 15 de 176050y = 0,148x - 5,008R 2 =
- Page 122: 17 de 17Correlación de Caudales me
- Page 125 and 126: 2 de 33Figura A 5-1Río Baker en An
- Page 127 and 128: 4 de 33CUADRO A 5-1Río Baker en An
- Page 129 and 130:
6 de 33Figura A 5-4Río Baker bajo
- Page 131 and 132:
8 de 338000Figura A 5-5Figura A 5-5
- Page 133 and 134:
10 de 33Figura A 5-7Río Del Salto
- Page 135 and 136:
12 de 33600Figura A 5-8Figura A 5-8
- Page 137 and 138:
14 de 33CUADRO A 5-5Río Pascua en
- Page 139 and 140:
16 de 33CUADRO A 5-6Río Pascua en
- Page 141 and 142:
18 de 33Figura A 5-11Río Pascua an
- Page 143 and 144:
20 de 332400Figura A 5-12Figura A 5
- Page 145 and 146:
22 de 33CUADRO A 5-8Río Chacabuco
- Page 147 and 148:
24 de 33CUADRO A 5-9Chacabuco antes
- Page 149 and 150:
26 de 33CUADRO A 5-10Los Ñadis ant
- Page 151 and 152:
28 de 33CUADRO A 5-12Río Del Salto
- Page 153 and 154:
30 de 33Figura A 5-16Río Baker ang
- Page 155 and 156:
32 de 33Río Pascua en desagüe lag
- Page 158 and 159:
1 de 20ANEXO 3CAUDALES MEDIOS DIARI
- Page 160 and 161:
3 de 20CUADRO A 4-14Río Baker en C
- Page 162 and 163:
5 de 20CUADRO A 4-16Río Baker en C
- Page 164 and 165:
7 de 20CUADRO A 4-18Río Baker bajo
- Page 166 and 167:
9 de 20CUADRO A 4-20Río Baker bajo
- Page 168 and 169:
11 de 20CUADRO A 4-22Río Baker en
- Page 170 and 171:
13 de 20CUADRO A 4-24Río Pascua en
- Page 172 and 173:
15 de 20CUADRO A 4-26Río Pascua en
- Page 174 and 175:
17 de 20CUADRO A 4-28Río Pascua en
- Page 176 and 177:
19 de 20CUADRO A 4-30Río Pascua en