- Page 2:
Cuenta Sectorial MINISTERIO DEL INT
- Page 6 and 7:
I. POLÍTICAS MINISTERIALES 1. Subs
- Page 8 and 9:
Cuadro 2: Entrega de Bonos de Enser
- Page 10 and 11:
Algo similar ocurrió con el terrem
- Page 12 and 13:
2014. Además, continúa el trabajo
- Page 14 and 15:
medianas y grandes, de las cuales 1
- Page 16 and 17:
F. GOBIERNO INTERIOR En 2015, se im
- Page 18 and 19:
• Programa Refugio e Inmigrantes
- Page 20 and 21:
tomas de muestras póstumas; de 45
- Page 22 and 23:
2. Subsecretaría de Prevención de
- Page 24 and 25:
B. CONSEJOS REGIONALES DE SEGURIDAD
- Page 26 and 27:
efectivo a las personas víctimas q
- Page 28 and 29:
- En el marco de la nueva ley vigen
- Page 30 and 31:
B. DIVISIÓN DE DESARROLLO REGIONAL
- Page 32 and 33:
C. DIVISIÓN DE MUNICIPALIDADES •
- Page 34 and 35:
Municipales. Además, con apoyo de
- Page 36 and 37:
En cuanto a las solicitudes de crea
- Page 38 and 39:
D. SERVICIO NACIONAL PARA LA PREVEN
- Page 40 and 41:
2. Subsecretaría de Prevención de
- Page 42 and 43:
K. PLATAFORMA DE ANÁLISIS CRIMINAL
- Page 44 and 45:
Además, en abril de 2016 se inaugu
- Page 46 and 47:
torno al fomento productivo amplian
- Page 48 and 49:
• Formación y Capacitación Muni
- Page 50:
Ministerio de Relaciones Exteriores
- Page 53 and 54:
Política Exterior al que concurran
- Page 55 and 56:
• Acuerdos comerciales suscritos
- Page 57 and 58:
CUENTA PÚBLICA 2016 en el marco de
- Page 59 and 60:
CUENTA PÚBLICA 2016 • Colombia E
- Page 61 and 62:
Los días 11 y 12 de agosto La Pres
- Page 63 and 64:
E. EUROPA - Plan Chile - California
- Page 65 and 66:
CUENTA PÚBLICA 2016 • Reino Unid
- Page 67 and 68:
• República de Corea Entre el 21
- Page 69 and 70:
CUENTA PÚBLICA 2016 significativa,
- Page 71 and 72:
J. ORGANIZACIÓN PARA LA COOPERACI
- Page 73 and 74:
M. OTRAS ORGANIZACIONES INTERNACION
- Page 75 and 76:
En cuanto al quehacer antártico na
- Page 77 and 78:
se espera que la Comisión Europea
- Page 79 and 80:
B. INTERNACIONALIZACIÓN DE LAS REG
- Page 81 and 82:
En el caso de las catástrofes ocur
- Page 83 and 84:
CUENTA PÚBLICA 2016 enfrentar la g
- Page 85 and 86:
3. Compromiso de Chile con la paz y
- Page 87 and 88:
Se otorgará especial atención al
- Page 89 and 90:
7. Avanzar en otros campos de inter
- Page 91 and 92:
Además, se realizarán tres diálo
- Page 94 and 95:
I. POLÍTICAS MINISTERIALES El Mini
- Page 96 and 97:
Asimismo, se finalizó el proceso a
- Page 98 and 99:
Centroamérica sostuvo su primera r
- Page 100 and 101:
comprometidas con el CDS/Unasur, an
- Page 102 and 103:
D. SERVICIO MILITAR OBLIGATORIO El
- Page 104 and 105:
Con la entrada en vigencia de la Le
- Page 106 and 107:
En el mismo contexto, en la reunió
- Page 108 and 109:
H. PROGRAMA DE COOPERACIÓN DE DEFE
- Page 110 and 111:
4. Ejército Los principales esfuer
- Page 112 and 113:
• En el área de la fiscalizació
- Page 114 and 115:
• Aéreo, entre Coyhaique y Villa
- Page 116 and 117:
centros de alerta más importantes
- Page 118 and 119:
ambiental que generaría la interve
- Page 120 and 121:
• Acrux Chiloé Del 8 al 18 de oc
- Page 122 and 123:
odontólogos, personal del área lo
- Page 124 and 125:
La Escuadrilla de Alta Acrobacia Ha
- Page 126 and 127:
• Se seguirá contribuyendo a org
- Page 128 and 129:
• Se iniciará un proceso de marc
- Page 130 and 131:
- Dictada la Política Militar, la
- Page 132 and 133:
difundido el año 2014, que permita
- Page 134 and 135:
y Capitán. Este proceso será lide
- Page 136 and 137:
E. INTEGRACIÓN DE LAS UNIDADES Y D
- Page 138 and 139:
• Se participará en ejercicios c
- Page 140:
Ministerio de Hacienda
- Page 143 and 144:
II. PRINCIPALES LOGROS ALCANZADOS D
- Page 145 and 146:
número cada vez mayor de empresas
- Page 147 and 148:
2. Organismos relacionados y depend
- Page 149 and 150:
D. SERVICIO NACIONAL DE ADUANAS, SN
- Page 151 and 152:
perfeccionamiento del Sistema Nacio
- Page 153 and 154:
III. ACCIONES PROGRAMADAS PARA EL P
- Page 155 and 156:
• Simplificación de trámites: -
- Page 157 and 158:
D. COMITÉ ASESOR PRESIDENCIAL DE I
- Page 159 and 160:
8. Programa Sistema Integrado de Co
- Page 161 and 162:
total de la cartera que se encuentr
- Page 163 and 164:
G. SUPERINTENDENCIA DE CASINOS DE J
- Page 165 and 166:
jurídicas y de gestión de persona
- Page 168 and 169:
I. POLÍTICAS MINISTERIALES 1. Obje
- Page 170 and 171:
II. PRINCIPALES LOGROS ALCANZADOS D
- Page 172 and 173:
c. En relación a los escritos judi
- Page 174 and 175:
4. División de Relaciones Polític
- Page 176 and 177:
• Con el Ministerio de Defensa se
- Page 178 and 179:
• Se participó en reuniones de c
- Page 180 and 181:
Integrado de Control Interno - Coso
- Page 182 and 183:
III. ACCIONES PROGRAMADAS PARA EL P
- Page 184 and 185:
5. Unidad de Modernización y Gobie
- Page 186 and 187:
- En lo referido a la mantención y
- Page 188 and 189:
c. Se fortalecerán las relaciones
- Page 190 and 191:
Ministerio Secretaría General de G
- Page 192 and 193:
I. POLÍTICAS MINISTERIALES 1. Misi
- Page 194 and 195:
II. PRINCIPALES LOGROS ALCANZADOS D
- Page 196 and 197:
• OIRS La Oficina de Información
- Page 198 and 199:
2. Acciones orientadas a promover l
- Page 200 and 201:
3. Acciones sobre el Consejo Nacion
- Page 202 and 203:
alertas destinadas a informar oport
- Page 204 and 205:
• Unidad de Contenidos Digitales
- Page 206 and 207:
III. ACCIONES PROGRAMADAS PARA EL P
- Page 208 and 209:
ciudadano-Estado, no sólo como una
- Page 210 and 211:
A. PROCESO CONSTITUYENTE Se dará
- Page 212:
Ministerio de Economía, Fomento y
- Page 215 and 216:
II. PRINCIPALES LOGROS OBTENIDOS DU
- Page 217 and 218:
solar, alimentos saludables, turism
- Page 219 and 220:
Se lanzó una herramienta tecnológ
- Page 221 and 222:
además de servicios especializados
- Page 223 and 224:
Junto a lo anterior, se lanzó un s
- Page 225 and 226:
4. Apoyo a la Pyme Las empresas de
- Page 227 and 228:
C. ACCESO A MERCADOS En enero de 20
- Page 229 and 230:
ecepción de servicios de telecomun
- Page 231 and 232:
fortalecimiento del Instituto de Fo
- Page 233 and 234:
9. Estadísticas públicas Durante
- Page 235 and 236:
a la recuperación de Atacama con l
- Page 237 and 238:
III. ACCIONES PROGRAMADAS PARA EL P
- Page 239 and 240:
f. Se implementará un Plan Anual d
- Page 241 and 242:
Azúcar, Parque Nacional Villarrica
- Page 243 and 244:
CUENTA PÚBLICA 2016 242
- Page 245 and 246:
CUENTA PÚBLICA 2016 244
- Page 247 and 248:
k. Promover la inserción en la soc
- Page 249 and 250:
Al cierre del año 2015, el Registr
- Page 251 and 252:
pueblos indígenas que habitan nues
- Page 253 and 254:
visual y motora; un libro para el f
- Page 255 and 256:
programa es ejecutado a través de
- Page 257 and 258:
Desde esa perspectiva, se financiar
- Page 259 and 260:
Al 31 de diciembre de 2015, se alca
- Page 261 and 262:
CUENTA PÚBLICA 2016 En términos d
- Page 263 and 264:
CUENTA PÚBLICA 2016 municipalidade
- Page 265 and 266:
CUENTA PÚBLICA 2016 • Fondo Part
- Page 267 and 268:
406 hombres—, quienes además de
- Page 269 and 270:
un presupuesto ejecutado al primer
- Page 271 and 272:
- Convenios de asignación directa
- Page 273 and 274:
- Se iniciará un cambio en la red
- Page 275 and 276:
Ambiental, con dos meses de antelac
- Page 277 and 278:
con grandes entidades públicas y p
- Page 279 and 280:
enfoque de equidad de género y ter
- Page 282 and 283:
I. POLÍTICAS MINISTERIALES 1. Misi
- Page 284 and 285:
Sistema Nacional Docente —ambas e
- Page 286 and 287:
Por otra parte, se comenzó con el
- Page 288 and 289:
Así, durante el mes de marzo de 20
- Page 290 and 291:
Adicionalmente, el pago de asignaci
- Page 292 and 293:
2º básico a todo el sistema escol
- Page 294 and 295:
Junto al Ministerio de Transportes
- Page 296 and 297:
necesidades, se ajustaba a su proye
- Page 298 and 299:
H. CURRÍCULUM NACIONAL Con el prop
- Page 300 and 301:
como también el buen uso de los re
- Page 302 and 303:
D. .APROBACIÓN DE LEY QUE CREA QUI
- Page 304 and 305:
que el Programa de Astronomía adju
- Page 306 and 307:
de la carrera —por un plazo de tr
- Page 308 and 309:
Se iniciarán, además, los primero
- Page 310 and 311:
establecimiento. Además, se pondr
- Page 312 and 313:
• Condiciones de Calidad para la
- Page 314 and 315:
B. VINCULACIÓN CON EL ENTORNO PROD
- Page 316:
Ministerio de Justicia
- Page 319 and 320:
En el mismo marco, se ejecutaron pr
- Page 321 and 322:
CUENTA PÚBLICA 2016 proporcionar a
- Page 323 and 324:
CUENTA PÚBLICA 2016 remunerada. Lo
- Page 325 and 326:
CUENTA PÚBLICA 2016 ha demostrado
- Page 327 and 328:
CUENTA PÚBLICA 2016 * Se continuó
- Page 329 and 330:
CUENTA PÚBLICA 2016 Adicionalmente
- Page 331 and 332:
CUENTA PÚBLICA 2016 perfiles de co
- Page 333 and 334:
Por otra parte, durante el año 201
- Page 335 and 336:
El proyecto procura el establecimie
- Page 337 and 338:
del país, de diversas regiones y c
- Page 339 and 340:
• Ley para facilitar la aplicaci
- Page 341 and 342:
CUENTA PÚBLICA 2016 adquirir algun
- Page 343 and 344:
CUENTA PÚBLICA 2016 • Gendarmer
- Page 345 and 346:
- Fortalecimiento del peritaje psic
- Page 347 and 348:
B. DESPENALIZACIÓN DE LA INTERRUPC
- Page 349 and 350:
Metropolitana, se continuará con e
- Page 352:
Ministerio del Trabajo y Previsión
- Page 355 and 356:
2. Subsecretaría de Previsión Soc
- Page 357 and 358:
De esta manera se busca impulsar el
- Page 359 and 360:
egiones de Chile; el lanzamiento de
- Page 361 and 362:
- Línea Mujer Emprendedora, formac
- Page 363 and 364:
CUENTA PÚBLICA 2016 * Construcció
- Page 365 and 366:
CUENTA PÚBLICA 2016 trabajadores.
- Page 367 and 368:
de Pensiones; se les otorga derecho
- Page 369 and 370:
Del mismo modo, a fines de enero de
- Page 371 and 372:
III. ACCIONES PROGRAMADAS PARA EL P
- Page 373 and 374:
manera pertinente los procesos y/o
- Page 375 and 376:
con el objeto de difundir y enseña
- Page 377 and 378:
n. Trabajo infantil • Se espera l
- Page 379 and 380:
D. PROFUNDIZACIÓN DEL PLAN DE FISC
- Page 381 and 382:
c. Mejorar el actual Sistema de Pen
- Page 383 and 384:
CUENTA PÚBLICA 2016 382
- Page 386 and 387:
I. POLÍTICAS MINISTERIALES El Mini
- Page 388 and 389:
c. Desarrollar obras de infraestruc
- Page 390 and 391:
- En la Región de Los Lagos, las o
- Page 392 and 393:
en infraestructura y asegurar su ma
- Page 394 and 395:
- Se llevaron a cabo las normalizac
- Page 396 and 397:
de la música, la danza y el teatro
- Page 398 and 399:
de Magallanes y Antártica Chilena,
- Page 400 and 401:
5. Borde costero, zonas ribereñas
- Page 402 and 403:
• La sequía que afecta a las reg
- Page 404 and 405:
- Por concepto de pago de patente p
- Page 406 and 407:
Araucanía, Aguas Patagonia y Aguas
- Page 408 and 409:
Públicas al diseño definitivo del
- Page 410 and 411:
G. PLAN AGENDA INFRAESTRUCTURA, DES
- Page 412 and 413:
B. CONECTIVIDAD VIAL INTERURBANA Du
- Page 414 and 415:
- Paso Río Don Guillermo. Se inici
- Page 416 and 417:
3. Edificación pública y espacios
- Page 418 and 419:
millones de dólares. Esta iniciati
- Page 420 and 421:
etapa del colector Las Camelias de
- Page 422 and 423:
6. Planes Regionales de Infraestruc
- Page 424 and 425:
G. PLAN AGENDA INFRAESTRUCTURA, DES
- Page 426:
Ministerio de Salud
- Page 429 and 430:
II. PRINCIPALES LOGROS ALCANZADOS D
- Page 431 and 432:
B. ATENCIÓN PRIMARIA EN SALUD Cent
- Page 433 and 434:
Presente en 242 comunas del país,
- Page 435 and 436:
B. FOROS DE SALUD PÚBLICA REGIONAL
- Page 437 and 438:
Se inició, además, la certificaci
- Page 439 and 440:
13. Plan Nacional de Salud Bucal ce
- Page 441 and 442:
Al 31 de marzo del año 2014, un mi
- Page 443 and 444:
atención médica en el domicilio d
- Page 445 and 446:
B. ACUERDOS CON LAS Y LOS TRABAJADO
- Page 447 and 448:
Esta gestión permitió incrementar
- Page 449 and 450:
Además, en febrero de 2016 el Fona
- Page 451 and 452:
- Bioequivalencia Productos declara
- Page 453 and 454:
III. ACCIONES PROGRAMADAS PARA EL P
- Page 455 and 456:
4. Vacunas e inmunizaciones A. CAMB
- Page 457 and 458:
Asimismo, se continuará la ejecuci
- Page 459 and 460:
Ñ. ÁMBITO LEGISLATIVO INTERSECTOR
- Page 462 and 463:
I. POLÍTICAS MINISTERIALES Un paí
- Page 464 and 465:
2. Ámbito Barrio En este ámbito,
- Page 466 and 467:
el proceso de evaluación de proyec
- Page 468 and 469:
Presupuestos Ley Sector Vivienda (c
- Page 470 and 471:
En infraestructura urbana se ejecut
- Page 472 and 473:
3. Avance de Medidas Presidenciales
- Page 474 and 475:
familias con la creación del Siste
- Page 476 and 477:
• Establecimientos de Larga Estad
- Page 478 and 479:
− Calidad de la vivienda Como par
- Page 480 and 481:
B. ÁMBITO BARRIOS con subsidios pr
- Page 482 and 483:
En Brisas del Mar-Nuevo Horizonte,
- Page 484 and 485:
Tiltil, comuna de Tiltil. En todas
- Page 486 and 487:
- EL D.S. N°19, del 20 de enero de
- Page 488 and 489:
G. AGENDA INTERNACIONAL En concorda
- Page 490 and 491:
• Se terminará el diseño del pr
- Page 492 and 493:
I. GESTIÓN PARA LA REDUCCIÓN DE R
- Page 494 and 495:
espectivamente; mientras que en los
- Page 496 and 497:
* El Plan de Gestión de Calidad Mi
- Page 498 and 499:
C. ÁMBITO CIUDAD • Ampliar el ac
- Page 500 and 501:
- El proyecto de ley sobre transpar
- Page 502:
Ministerio de Agricultura
- Page 505 and 506:
los mercados, a la tierra y a los r
- Page 507 and 508:
4. Ampliación de los mercados exte
- Page 509 and 510:
se han creado programas de fomento
- Page 511 and 512:
B. PROGRAMA DE DESARROLLO DE LA COM
- Page 513 and 514:
E. FINANCIAMIENTO PARA LA AGRICULTU
- Page 515 and 516:
Asimismo, y en relación a los posi
- Page 517 and 518:
Además de las comisiones nacionale
- Page 519 and 520:
B. PROGRAMAS DE CONTROL DE ENFERMED
- Page 521 and 522:
F. PROTECCIÓN Y COMBATE AL FUEGO E
- Page 523 and 524:
• Disminución en las barreras de
- Page 525 and 526:
Es importante destacar también que
- Page 527 and 528:
como papa, maíz, tumbo y locoto. P
- Page 529 and 530:
B. FOMENTO DE LA ASOCIATIVIDAD A tr
- Page 531 and 532:
4. Mejoramiento del funcionamiento
- Page 533 and 534:
cuenten con el certificado que acre
- Page 535 and 536:
7. Riego En 2016, mediante recursos
- Page 537 and 538:
D. PATRIMONIO BIOLÓGICO Y GENÉTIC
- Page 540 and 541:
I. POLÍTICAS MINISTERIALES El futu
- Page 542 and 543:
y conocimiento. Es decir, la tarea
- Page 544 and 545:
complementar y fortalecer el Progra
- Page 546 and 547:
- Levantar perfiles laborales de la
- Page 548 and 549:
- En el marco del Consejo de Minist
- Page 550 and 551:
- En conjunto con Codelco y la Enam
- Page 552 and 553:
2. Servicios dependientes A. COMISI
- Page 554 and 555: - Adicionalmente a la fiscalizació
- Page 556 and 557: que es necesario agregar la difusi
- Page 558 and 559: - Se emitieron y distribuyeron 132
- Page 560 and 561: gestiones para la contratación de
- Page 562 and 563: Adicionalmente, participa en un 49
- Page 564 and 565: • Se trabajará para fortalecer l
- Page 566 and 567: G. CLÚSTER MINERO El Ministerio de
- Page 568 and 569: conjunto de modificaciones al actua
- Page 570: Ministerio de Transportes y Telecom
- Page 573 and 574: II. PRINCIPALES LOGROS ALCANZADOS D
- Page 575 and 576: CUENTA PÚBLICA 2016 - Metro Como p
- Page 577 and 578: • Servicios ferroviarios en regio
- Page 579 and 580: CUENTA PÚBLICA 2016 • Seguridad
- Page 581 and 582: • Plantas de Revisión Técnica D
- Page 583 and 584: Concretamente, en diciembre del añ
- Page 585 and 586: - Norma técnica relativa a la nume
- Page 587 and 588: • Fiscalización de neutralidad d
- Page 589 and 590: - Fiscalización de gestión de fal
- Page 591 and 592: III. ACCIONES PROGRAMADAS PARA EL P
- Page 593 and 594: aisladas, de conectividad rural y d
- Page 595 and 596: Se adoptarán, también, nuevas exi
- Page 597 and 598: C. WIFI CHILEGOB FASE 3, FASE 4 Y E
- Page 599 and 600: distinto tipo informadas por los op
- Page 602 and 603: I. POLÍTICAS MINISTERIALES 1. Misi
- Page 606 and 607: Se destaca también la tramitación
- Page 608 and 609: El gobierno busca diversificar la m
- Page 610 and 611: Por otra parte, durante el año 201
- Page 612 and 613: Entre los concesionarios se cuentan
- Page 614 and 615: compromiso presidencial de resolver
- Page 616 and 617: la tramitación de estos expediente
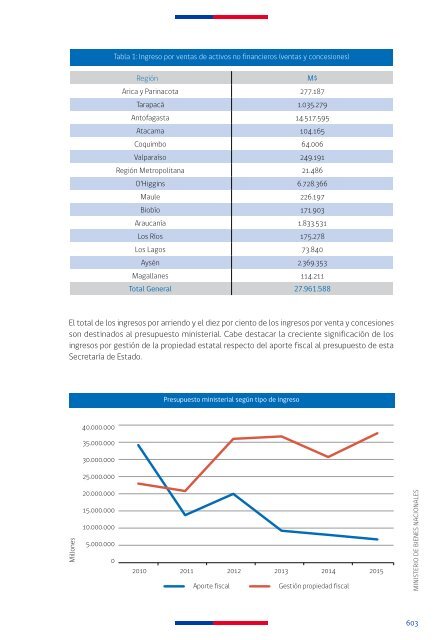
- Page 618 and 619: • Red de vértices geodésicos Pa
- Page 620 and 621: • La Secretaría Ejecutiva del Si
- Page 622 and 623: C. SERVICIO DE INFORMACIÓN Y ATENC
- Page 624 and 625: E. CONSERVAR TERRITORIOS DE CARACTE
- Page 626: Ministerio de Energía
- Page 629 and 630: B. LICITACIONES DE SUMINISTRO ELÉC
- Page 631 and 632: Cabe precisar que hace 30 años, la
- Page 633 and 634: Otro programa relevante es el de ap
- Page 635 and 636: conjuntamente por los ministerios d
- Page 637 and 638: G. ACCESO A LA ENERGÍA Mejorar el
- Page 639 and 640: CUENTA PÚBLICA 2016 incluye Chile
- Page 641 and 642: I. ENERGÍA 2050 El documento Energ
- Page 643 and 644: la construcción de las políticas
- Page 645 and 646: 3. Eficiencia Energética y gestió
- Page 647 and 648: CUENTA PÚBLICA 2016 646
- Page 650 and 651: I. POLÍTICAS MINISTERIALES 1. Misi
- Page 652 and 653: 4. Ámbitos de acción Para dar cue
- Page 654 and 655:
2. Regulación ambiental A. CALIDAD
- Page 656 and 657:
la responsabilidad de gestionar la
- Page 658 and 659:
4. Cambio climático Con el objetiv
- Page 660 and 661:
C. POLÍTICAS Y PLANIFICACIÓN DE L
- Page 662 and 663:
Tabla 1 Enero - Diciembre 2015 Inst
- Page 664 and 665:
órganos de la administración del
- Page 666 and 667:
III. ACCIONES PROGRAMADAS PARA EL P
- Page 668 and 669:
F. GESTIÓN DE OLORES En Chile se e
- Page 670 and 671:
el sentido de que el sector públic
- Page 672 and 673:
• Se realizará un amplio trabajo
- Page 674:
Ministerio del Deporte
- Page 677 and 678:
y coordinado con las instituciones
- Page 679 and 680:
en lo referente a cada componente.
- Page 681 and 682:
CUENTA PÚBLICA 2016 • Deporte en
- Page 683 and 684:
16 y sub 18. Estos juegos buscan pr
- Page 685 and 686:
y asesores metodológicos, compuest
- Page 687 and 688:
- Desarrollo paralímpico Component
- Page 689 and 690:
CUENTA PÚBLICA 2016 una quinta jor
- Page 691 and 692:
B. DONACIONES CON FINES DEPORTIVOS
- Page 693 and 694:
J. ESTADIO NELSON OYARZUN DE CHILLA
- Page 695 and 696:
C. PROPUESTAS extensas jornadas de
- Page 697 and 698:
6. Intersectorialidad a. A través
- Page 699 and 700:
8. Agenda legislativa El Ministerio
- Page 701 and 702:
A. ACTIVIDAD FÍSICA Y DEPORTE INFA
- Page 703 and 704:
De igual modo, y con una inversión
- Page 705 and 706:
el monto estimado. Al 31 de diciemb
- Page 707 and 708:
las indicaciones referidas a recono
- Page 709 and 710:
III. ACCIONES PROGRAMADAS PARA EL P
- Page 711 and 712:
CUENTA PÚBLICA 2016 710
- Page 714 and 715:
I. POLÍTICAS MINISTERIALES El Serv
- Page 716 and 717:
II. PRINCIPALES LOGROS ALCANZADOS D
- Page 718 and 719:
C. PROGRAMA MUJER, ASOCIATIVIDAD Y
- Page 720 and 721:
como en la implementación de los s
- Page 722 and 723:
- Servicio de atención telefónica
- Page 724 and 725:
agresor —al sumarse dos muertes p
- Page 726 and 727:
• Talleres Durante 2015 se realiz
- Page 728 and 729:
B. PARTICIPACIÓN POLÍTICA Con fec
- Page 730 and 731:
• El Seminario sobre Violencia In
- Page 732 and 733:
- Quince regiones han formulado y e
- Page 734 and 735:
- La Encuesta Nacional de Discapaci
- Page 736 and 737:
• Cultura - Se Incorporó el curr
- Page 738 and 739:
III. ACCIONES PROGRAMADAS PARA EL P
- Page 740 and 741:
• Se implementará una Guía de D
- Page 742 and 743:
• Se reinstalará la Mesa Mujer R
- Page 744:
Consejo Nacional de la Cultura y la
- Page 747 and 748:
II. PRINCIPALES LOGROS ALCANZADOS D
- Page 749 and 750:
. Respecto al perfeccionamiento de
- Page 751 and 752:
primer documento de trabajo para la
- Page 753 and 754:
Asimismo, se inauguraron los centro
- Page 755 and 756:
Además, se llevó adelante un tota
- Page 757 and 758:
d. Durante el año 2015, el Consejo
- Page 759 and 760:
6. Proceso de fortalecimiento de la
- Page 761 and 762:
7. Premios y reconocimientos A. ORD
- Page 763 and 764:
En 2015, y en el marco del Día de
- Page 765 and 766:
9. Hitos nacionales a. En agosto de
- Page 767 and 768:
En el mes de noviembre de 2015 se f
- Page 769 and 770:
el que el vestuario escénico y la
- Page 772:
Región de Arica y Parinacota
- Page 775 and 776:
• Con fondos regionales, se repus
- Page 777 and 778:
• En noviembre de 2015, se concre
- Page 779 and 780:
B. PESCA • En innovación, la Cor
- Page 781 and 782:
Asimismo, se ejecutaron diez progra
- Page 783 and 784:
300 millones de pesos. Además, se
- Page 785 and 786:
4. Derechos ciudadanos A. POBREZA
- Page 787 and 788:
G. ADULTOS MAYORES • La restituci
- Page 789 and 790:
III. ACCIONES PROGRAMADAS PARA EL P
- Page 791 and 792:
en el sector norte de Arica, y que
- Page 793 and 794:
plaza pública de Caquena, ambas de
- Page 795 and 796:
al proceso de captación y elaborac
- Page 797 and 798:
CUENTA PÚBLICA 2015 796
- Page 800 and 801:
I. ANTECEDENTES REGIONALES Tarapac
- Page 802 and 803:
C. EDUCACIÓN • Quince establecim
- Page 804 and 805:
2. Programa económico A. AGRICULTU
- Page 806 and 807:
F. HACIENDA Mediante la implementac
- Page 808 and 809:
de gran importancia, considerando q
- Page 810 and 811:
• Se cumplió con el 100 por cien
- Page 812 and 813:
III. ACCIONES PROGRAMADAS PARA EL P
- Page 814 and 815:
C. ENERGÍA • Se realizarán acci
- Page 816 and 817:
4. Derechos ciudadanos A. GOBIERNO
- Page 818:
Región de Antofagasta
- Page 821 and 822:
B. SALUD • El Programa de Acompa
- Page 823 and 824:
• Para garantizar que todos los b
- Page 825 and 826:
B. PESCA Taltal, Tocopilla y Sierra
- Page 827 and 828:
D. ENERGÍA • Se implementó la p
- Page 829 and 830:
• La línea crediticia del Instit
- Page 831 and 832:
• En el Programa Nacional de Ener
- Page 833 and 834:
habitacionales ejecutados por el Mi
- Page 835 and 836:
• Se desarrolló un Programa de G
- Page 837 and 838:
CUENTA PÚBLICA 2015 que genera acc
- Page 839 and 840:
Barrick Zaldivar, el Fosis, las mun
- Page 841 and 842:
B. PESCA • Se pondrán en marcha,
- Page 843 and 844:
• En materia de Agua Potable Rura
- Page 845 and 846:
CUENTA PÚBLICA 2015 844
- Page 848 and 849:
I. ANTECEDENTES REGIONALES La Regi
- Page 850 and 851:
D. SALUD • Se inició la construc
- Page 852 and 853:
generen no sólo un ahorro en las c
- Page 854 and 855:
involucradas son movimientos de tie
- Page 856 and 857:
• Algunas de las iniciativas fina
- Page 858 and 859:
con una remuneración de 200 mil pe
- Page 860 and 861:
oca, con el objetivo de disminuir l
- Page 862 and 863:
H. PROGRAMAS DE FOMENTO PRODUCTIVO
- Page 864 and 865:
- Postas de salud rural en Vallenar
- Page 866 and 867:
• Se contempla la ejecución de p
- Page 868 and 869:
• En el ámbito hídrico, se foca
- Page 870 and 871:
4. Derechos ciudadanos A. POBREZA P
- Page 872:
Región de Coquimbo
- Page 875 and 876:
B. EDUCACIÓN CUENTA PÚBLICA 2015
- Page 877 and 878:
de Illapel, obra que se encontraba
- Page 879 and 880:
B. PESCA - Tres mil 85 millones de
- Page 881 and 882:
CUENTA PÚBLICA 2015 • Vialidad u
- Page 883 and 884:
• Se desarrolló el Primer Plan N
- Page 885 and 886:
econversión agrícola, eficiencia
- Page 887 and 888:
D. DISCAPACIDAD • Se realizó el
- Page 889 and 890:
embarcaciones y reposición de arte
- Page 891 and 892:
2. Programa económico A. ECONOMÍA
- Page 893 and 894:
A. CULTURA • Se realizará el Fes
- Page 895 and 896:
CUENTA PÚBLICA 2015 894
- Page 898 and 899:
I. ANTECEDENTES REGIONALES La regi
- Page 900 and 901:
C. TRABAJO A través del Programa +
- Page 902 and 903:
• Se inició la ejecución de los
- Page 904 and 905:
Técnica Federico Santa María para
- Page 906 and 907:
B. VIVIENDA Y DESARROLLO URBANO •
- Page 908 and 909:
G. BIENES NACIONALES En regularizac
- Page 910 and 911:
activo, evitando o retardando la de
- Page 912 and 913:
subterránea en acero y hormigón,
- Page 914 and 915:
3. Descentralización, territorio y
- Page 916 and 917:
habitantes de las comunas de Cabild
- Page 918:
Región Metropolitana de Santiago
- Page 921 and 922:
CUENTA PÚBLICA 2015 • Se avanzó
- Page 923 and 924:
• En 32 establecimientos de la re
- Page 925 and 926:
• Se realizó el concurso públic
- Page 927 and 928:
• En el marco del Programa Santia
- Page 929 and 930:
D. CULTURA • Se implementó un ce
- Page 931 and 932:
4. Derechos ciudadanos A. SUPERACI
- Page 933 and 934:
F. JÓVENES • El Instituto Nacion
- Page 935 and 936:
• Se entregará equipamiento art
- Page 937 and 938:
tamaño de la zona sur-oriente y Pr
- Page 939 and 940:
de una pista de mil 150 metros de l
- Page 941 and 942:
F. TRANSPORTES Y TELECOMUNICACIONES
- Page 943 and 944:
D. EQUIDAD DE GÉNERO • Durante e
- Page 946 and 947:
I. ANTECEDENTES REGIONALES La Regi
- Page 948 and 949:
C. SALUD • Se aumentó la oferta
- Page 950 and 951:
D. TRABAJO • Para la promoción d
- Page 952 and 953:
B. ECONOMÍA • En el marco del Pr
- Page 954 and 955:
C. ADULTOS MAYORES • La atención
- Page 956 and 957:
4. Descentralización, territorio y
- Page 958 and 959:
• Dentro de las reposiciones más
- Page 960 and 961:
III. ACCIONES PROGRAMADAS PARA EL P
- Page 962 and 963:
2. Programa económico A. AGRICULTU
- Page 964 and 965:
De Alcantarillado Varios Sectores P
- Page 966:
Región del Maule
- Page 969 and 970:
CUENTA PÚBLICA 2015 • El Program
- Page 971 and 972:
CUENTA PÚBLICA 2015 • De los die
- Page 973 and 974:
• En proceso de implementación s
- Page 975 and 976:
• En materia de ruralidad, entró
- Page 977 and 978:
• Con recursos del Gobierno Regio
- Page 979 and 980:
4. Derechos ciudadanos A. POBREZA
- Page 981 and 982:
E. IGUALDAD, NO DISCRIMINACIÓN, PA
- Page 983 and 984:
D. SALUD • Se construirán dos nu
- Page 985 and 986:
C. CULTURA Internacional Pehuenche
- Page 987 and 988:
CUENTA PÚBLICA 2015 986
- Page 990 and 991:
I. ANTECEDENTES REGIONALES La Regi
- Page 992 and 993:
D. SALUD El Centro de Salud Familia
- Page 994 and 995:
significativa en la tramitación ta
- Page 996 and 997:
Las obras de la Costanera a Chiguay
- Page 998 and 999:
F. TRANSPORTE Se inauguró el nuevo
- Page 1000 and 1001:
de la estrategia nacional de reinse
- Page 1002 and 1003:
fortalecer la participación de las
- Page 1004 and 1005:
La Región del Biobío pondrá en m
- Page 1006 and 1007:
B. VIVIENDA Y DESARROLLO URBANO Dur
- Page 1008 and 1009:
Se entregarán mil 250 títulos de
- Page 1010:
Región de La Araucanía
- Page 1013 and 1014:
otorgarán atención a 860 niñas y
- Page 1015 and 1016:
inversión de mil 563 millones 358
- Page 1017 and 1018:
• Se firmó el convenio de progra
- Page 1019 and 1020:
F. TRANSPORTE Y TELECOMUNICACIONES
- Page 1021 and 1022:
• En noviembre de 2015 se inaugur
- Page 1023 and 1024:
D. SALUD • Se proyecta el inicio
- Page 1025 and 1026:
3. Descentralización, territorio y
- Page 1027 and 1028:
G. BIENES NACIONALES • Se contemp
- Page 1029 and 1030:
CUENTA PÚBLICA 2015 1028
- Page 1032 and 1033:
I. ANTECEDENTES REGIONALES La creac
- Page 1034 and 1035:
certero, pudiéndose hacer a la dis
- Page 1036 and 1037:
D. ENERGÍA El énfasis en esta ár
- Page 1038 and 1039:
problema histórico de la comuna de
- Page 1040 and 1041:
gestión de tránsito para las comu
- Page 1042 and 1043:
En el marco del programa Mujer, Ciu
- Page 1044 and 1045:
6. Programa económico A. ECONOMÍA
- Page 1046 and 1047:
Se espera hacer entrega al uso púb
- Page 1048 and 1049:
contempla una inversión de mil 928
- Page 1050:
Región de Los Lagos
- Page 1053 and 1054:
a través de 32 iniciativas y prepa
- Page 1055 and 1056:
2. Programa económico A. ECONOMÍA
- Page 1057 and 1058:
B. VIVIENDA Y DESARROLLO URBANO •
- Page 1059 and 1060:
el proceso de venta de los inmueble
- Page 1061 and 1062:
III. ACCIONES PROGRAMADAS PARA EL P
- Page 1063 and 1064:
2. Programa económico A. ECONOMÍA
- Page 1065 and 1066:
• Durante el segundo semestre ent
- Page 1067 and 1068:
F. TRANSPORTE Y TELECOMUNICACIONES
- Page 1070 and 1071:
I. ANTECEDENTES REGIONALES La Regi
- Page 1072 and 1073:
• El Programa de Vigilancia de Ma
- Page 1074 and 1075:
E. PESCA • Durante el año 2015,
- Page 1076 and 1077:
4. Derechos ciudadanos A. SUPERACI
- Page 1078 and 1079:
D. SALUD servicios institucionales,
- Page 1080 and 1081:
C. MEDIO AMBIENTE • Se implementa
- Page 1082 and 1083:
4. Derechos ciudadanos A. SUPERACI
- Page 1084:
Región de Magallanes y la Antárti
- Page 1087 and 1088:
• En relación al compromiso de i
- Page 1089 and 1090:
E. JUSTICIA • Se hizo entrega ofi
- Page 1091 and 1092:
energéticos, el acceso a la energ
- Page 1093 and 1094:
• En Punta Arenas se dio inicio a
- Page 1095 and 1096:
• Para mejorar la conectividad en
- Page 1097 and 1098:
G. DISCAPACIDAD • A partir de un
- Page 1099 and 1100:
• A las cuatro Oficinas de Protec
- Page 1101 and 1102:
a la ciudad de Puerto Natales, mejo
- Page 1103:
B. DERECHOS HUMANOS • En el marco