- Page 1 and 2:
RAPPORTANNUEL2010LA VENTE À DISTAN
- Page 3 and 4:
Plus dE 60 ansau sErvicE dE nos cli
- Page 5 and 6:
lE grouPE touPargElEntrEtiEn avEc l
- Page 7 and 8:
lE grouPE touPargEllE comité Exéc
- Page 9 and 10:
lE marché alimEntairELa livraison
- Page 11 and 12: lE marché du surgElédu surgeléUn
- Page 13 and 14: L’AcTiviTé surGeLésL'offre de s
- Page 15 and 16: L’AcTiviTé surGeLésL'offre de s
- Page 17 and 18: L’AcTiviTé surGeLésL'offre prod
- Page 19 and 20: L’AcTiviTé surGeLésL'offre prod
- Page 21 and 22: L’AcTiviTé surGeLésLA MArque To
- Page 23 and 24: L’AcTiviTé surGeLésLA venTe MuL
- Page 25 and 26: l'activité Frais et éPiceriel'oFF
- Page 27 and 28: l'activité Frais et éPiceriela ve
- Page 29 and 30: le développemeNt durableles eNjeux
- Page 31 and 32: le développemeNt durableles eNjeux
- Page 33 and 34: le développemeNt durableles eNjeux
- Page 35 and 36: le développemeNt durableles eNjeux
- Page 37 and 38: le développemeNt durableles eNjeux
- Page 39 and 40: le développemeNt durableles eNjeux
- Page 41 and 42: le développemeNt durableles eNjeux
- Page 43 and 44: le développemeNt durableles eNjeux
- Page 45 and 46: LE GoUVErnEMEnt d’EntrEPriSELE Fo
- Page 47 and 48: LE GoUVErnEMEnt d’EntrEPriSELE Fo
- Page 49 and 50: LE GoUVErnEMEnt d’EntrEPriSELE Fo
- Page 51 and 52: LE GoUVErnEMEnt d’EntrEPriSELE Fo
- Page 53 and 54: LE GoUVErnEMEnt d’EntrEPriSELE Fo
- Page 55 and 56: LE GoUVErnEMEnt d’EntrEPriSELE Co
- Page 57 and 58: LE GoUVErnEMEnt d’EntrEPriSELE Co
- Page 59 and 60: LE GoUVErnEMEnt d’EntrEPriSELE Co
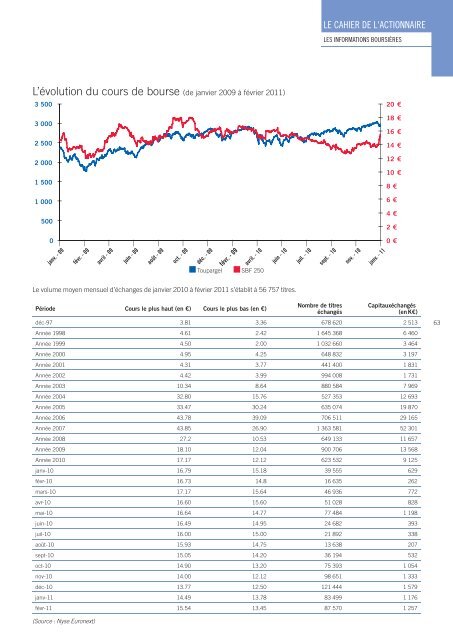
- Page 61: le cahier de l'actionnaireles infor
- Page 65 and 66: le cahier de l'actionnaireles infor
- Page 67 and 68: le cahier de l’actionnaireles inf
- Page 69 and 70: le cahier de l’actionnaireles pri
- Page 71 and 72: LE RAPPORT FINANCIERLe rapportfinan
- Page 73 and 74: LE RAPPORT FINANCIERLEs COmPTEs CON
- Page 75 and 76: LE RAPPORT FINANCIERLEs COmPTEs CON
- Page 77 and 78: LE RAPPORT FINANCIERLEs COmPTEs CON
- Page 79 and 80: LE RAPPORT FINANCIERLEs COmPTEs CON
- Page 81 and 82: LE RAPPORT FINANCIERLEs COmPTEs CON
- Page 83 and 84: LE RAPPORT FINANCIERLEs COmPTEs CON
- Page 85 and 86: LE RAPPORT FINANCIERLEs COmPTEs CON
- Page 87 and 88: LE RAPPORT FINANCIERLEs COmPTEs CON
- Page 89 and 90: LE RAPPORT FINANCIERLEs COmPTEs CON
- Page 91 and 92: LE RAPPORT FINANCIERLEs COmPTEs CON
- Page 93 and 94: LE RAPPORT FINANCIERLEs COmPTEs CON
- Page 95 and 96: LE RAPPORT FINANCIERLEs COmPTEs CON
- Page 97 and 98: LE RAPPORT FINANCIERLEs COmPTEs CON
- Page 99 and 100: LE RAPPORT FINANCIERLEs COmPTEs CON
- Page 101 and 102: LE RAPPORT FINANCIERLEs COmPTEs CON
- Page 103 and 104: LE RAPPORT FINANCIERLEs COmPTEs CON
- Page 105 and 106: LE RAPPORT FINANCIERLEs COmPTEs CON
- Page 107 and 108: LE RAPPORT FINANCIERLEs COmPTEs CON
- Page 109 and 110: LE RAPPORT FINANCIERLEs COmPTEs CON
- Page 111 and 112: LE RAPPORT FINANCIERLEs COmPTEs CON
- Page 113 and 114:
LE RAPPORT FINANCIERLEs COmPTEs CON
- Page 115 and 116:
LE RAPPORT FINANCIERLEs COmPTEs CON
- Page 117 and 118:
LE RAPPORT FINANCIERLEs COmPTEs CON
- Page 119 and 120:
LE RAPPORT FINANCIERLEs COmPTEs CON
- Page 121 and 122:
LE RAPPORT FINANCIERLEs COmPTEs CON
- Page 123 and 124:
LE RAPPORT FINANCIERLEs COmPTEs CON
- Page 125 and 126:
LE RAPPORT FINANCIERLEs COmPTEs CON
- Page 127 and 128:
LE RAPPORT FINANCIERLEs COmPTEs CON
- Page 129 and 130:
LE RAPPORT FINANCIERLEs COmPTEs CON
- Page 131 and 132:
LE RAPPORT FINANCIERLEs COmPTEs CON
- Page 133 and 134:
LE RAPPORT FINANCIERLEs COmPTEs CON
- Page 135 and 136:
LE RAPPORT FINANCIERLEs COmPTEs sOC
- Page 137 and 138:
LE RAPPORT FINANCIERLEs COmPTEs sOC
- Page 139 and 140:
LE RAPPORT FINANCIERLEs COmPTEs sOC
- Page 141 and 142:
LE RAPPORT FINANCIERLEs COmPTEs sOC
- Page 143 and 144:
LE RAPPORT FINANCIERLEs COmPTEs sOC
- Page 145 and 146:
LE RAPPORT FINANCIERLEs COmPTEs sOC
- Page 147 and 148:
LE RAPPORT FINANCIERLEs COmPTEs sOC
- Page 149 and 150:
LE RAPPORT FINANCIERLEs COmPTEs sOC
- Page 151 and 152:
LE RAPPORT FINANCIERLEs COmPTEs sOC
- Page 153 and 154:
LE RAPPORT FINANCIERLEs COmPTEs sOC
- Page 155 and 156:
LE RAPPORT FINANCIERLEs COmPTEs sOC
- Page 157 and 158:
Les informationsjuridiquesRenseigne
- Page 159 and 160:
AuTREs INFORmATIONsINFORmATIONs juR
- Page 161 and 162:
AuTREs INFORmATIONsINFORmATIONs juR
- Page 163 and 164:
AuTREs INFORmATIONsINFORmATIONs juR
- Page 165 and 166:
AuTREs INFORmATIONsATTEsTATION du R
- Page 167 and 168:
21.1.2. Actions non représentative