Edge effects on ground beetles 3-37.5-22.5-2.5 2.5 22.5 37.5Distance from boundary (m)Figure 1 Transect crossing a woodlot–field boundary. The cups underthe distance axis repres<strong>en</strong>t pitfall traps. Small arrowheads repres<strong>en</strong>ttraps that were pres<strong>en</strong>t only in the sites with the <strong>la</strong>rg<strong>est</strong> woodlots (W11-soybean and W13-wheat), whereas <strong>la</strong>rge arrowheads repres<strong>en</strong>t trapsthat were pres<strong>en</strong>t in all sites. Negative values of distance repres<strong>en</strong>t op<strong>en</strong>habitat.forming the 10-m diagonals of a square with traps in the cornersand at the c<strong>en</strong>tre (distances from the near<strong>est</strong> edge were 40, 60,80 and 130 m, respectively, in W1, W2, W11 and W13).Pitfall traps are <strong>la</strong>rgely used to study ground beetles becausethey comprise a simple and affordable method. Nonetheless, itis noteworthy that their catches do not measure the real d<strong>en</strong>sityof species; rather, they give a measure of the activity d<strong>en</strong>sity ofthe species at the p<strong>la</strong>ce where the traps are positioned (Thiele,1977). Traps were unbaited and consisted of a p<strong>la</strong>stic cup witha funnel (diameter 8 cm) level with the soil surface. Theycontained 100 mL of 5% formaldehyde solution to preserve thebeetles. Ground beetles being active mostly betwe<strong>en</strong> April andOctober in the region of the study, the traps were in p<strong>la</strong>ce allover this period (7 months) to catch both early and <strong>la</strong>te species,although they were left op<strong>en</strong> only for 1 week/month to limit th<strong>en</strong>umber of catches. Sampling ground beetles during 1 week permonth is not exhaustive but we considered that discontinuoustrapping was suffici<strong>en</strong>t for a comparative study (Barbosa &Marquet, 2002; Baker et al., 2007; Ewers & Didham, 2008).The pattern of edge effects on the diversity of ground beetlesat a for<strong>est</strong>–grass<strong>la</strong>nd boundary has be<strong>en</strong> shown to be simi<strong>la</strong>rduring two consecutive years (Magura et al., 2001). As in moststudies concerning edge effects on ground beetles, we thussampled ground beetles during a single year (Bedford & Usher,1994; Barbosa & Marquet, 2002; Magura, 2002; Taboada et al.,2004; Baker et al., 2007; Gaublomme et al., 2008). Groundbeetles were id<strong>en</strong>tified to species with morphological keys(Jeannel, 1942; Hùrka, 1996) and named according to FaunaEuropea (2010). We summed ground beetle abundance over thewhole trapping period and used species abundances per trap foranalysis.The species caught were grouped into for<strong>est</strong> species,g<strong>en</strong>eralist species and op<strong>en</strong> habitat species in accordance withprevious publications (Lindroth, 1945; Thiele, 1977; Hùrka,1996; Ribera et al., 1999; Fournier & Loreau, 2001; Thomaset al., 2002; Pizzolotto et al., 2005) and previous observationsmade in the study site (A. Roume, unpublished data). Only fourspecies out of 46 (corresponding to 22 individuals) could notbe attributed to a particu<strong>la</strong>r group because no information wasfound about their habitat (App<strong>en</strong>dix).Environm<strong>en</strong>tal variables were recorded in the immediatesurroundings of each trap (in a radius of 1 m) to observesubtle differ<strong>en</strong>ces along the transects that could exp<strong>la</strong>in speciesassemb<strong>la</strong>ge changes. We measured ground moisture in the first5 cm of soil (Hygrometer Thetaprobe ML2x; Dynamex Inc.,Houston, Texas), light int<strong>en</strong>sity (luxmeter HANNA HI 975000;Hanna Instrum<strong>en</strong>ts, Woonsocket, Rhode Is<strong>la</strong>nd), bare groundand ground cover by moss, litter and dead wood using the visual<strong>est</strong>imate vegetation coverage grid of Prodon and Lebreton(1981). Vegetation cover in the 0–25, 25–50 and 50–100 cmstrata was also <strong>est</strong>imated by the same visual method, and it was<strong>est</strong>imated by the number of interceptions of a vertical pole byvegetation in the 1–2, 2–4 and 4–6 strata.Statistical analysisAs a first step, we performed correspond<strong>en</strong>ce analysis of theabundance of ground beetle species from all the traps to validatethe exist<strong>en</strong>ce of two distinct species assemb<strong>la</strong>ges of groundbeetles in woodlots and op<strong>en</strong> habitats. The analysis was alsoperformed to check whether species assemb<strong>la</strong>ges in edgeswere clearly separated from those of both adjac<strong>en</strong>t habitatsor constituted a transition betwe<strong>en</strong> them. The main axes werethus interpreted according to their re<strong>la</strong>tionships with habitat(woodlot, op<strong>en</strong> habitat or edge) and with specific sites in whichthe traps were located.Second, because the species assemb<strong>la</strong>ge of edges was foundto constitute a transition betwe<strong>en</strong> adjac<strong>en</strong>t species assemb<strong>la</strong>ges,we th<strong>en</strong> determined the DEI on the species assemb<strong>la</strong>ge ofground beetles by nonlinear canonical analysis of principalcoordinates (NCAP). This method consists of an ordination ofspecies assemb<strong>la</strong>ges followed by a nonlinear regression of thefirst principal coordinate(s) of this ordination, performed on thedistance from the boundary (Mil<strong>la</strong>r et al., 2005). We chose alogistic model for this regression because we expected variationsin the species assemb<strong>la</strong>ge of ground beetles to be steep<strong>est</strong>near the boundary and to decrease further from the boundary(Mil<strong>la</strong>r et al., 2005; Baker et al., 2007). The DEI was computedas the distance from the boundary giving an assemb<strong>la</strong>gesimi<strong>la</strong>r to the <strong>est</strong>imated species assemb<strong>la</strong>ge of the habitat c<strong>en</strong>treat the 95% level (i.e. if the NCAP score characterizingwoodlots is 1 and that characterizing op<strong>en</strong> habitats is 0, th<strong>en</strong>the respective DEIs in woodlots and op<strong>en</strong> habitats are the distancesfrom the boundary at which the score <strong>est</strong>imated with thelogistic regression is equal to 0.95 and 0.05). The mathematicalform of the logistic model fixes a symmetrical curve around theinflection point (corresponding to the boundary in the model)and thus an equal DEI in the two adjac<strong>en</strong>t habitats, whichmay be ecologically inappropriate. To measure DEI in woodlotswithout the constraint of a symmetrical curve around theboundary, we chose to apply the method separately on woodlotsand op<strong>en</strong> habitats. For woodlots, we applied the methodonly to woodlot traps, and traps located 2.5 and 22.5 m fromthe boundary in the op<strong>en</strong> habitats (i.e. to repres<strong>en</strong>t the op<strong>en</strong>habitat extremity of the species assemb<strong>la</strong>ge gradi<strong>en</strong>t). Th<strong>en</strong>,we computed the DEI in op<strong>en</strong> habitat by using all op<strong>en</strong> habitattraps and those located 2.5 and 22.5 m from the boundary in thewoodlots.Third, we re<strong>la</strong>ted the position of species assemb<strong>la</strong>ges on thewoodlot-op<strong>en</strong> habitat gradi<strong>en</strong>t (i.e. the score of traps giv<strong>en</strong> byNCAP, used here as the response variable) with <strong>en</strong>vironm<strong>en</strong>tal© 2011 The AuthorsAgricultural and For<strong>est</strong> Entomology © 2011 The Royal Entomological Society, Agricultural and For<strong>est</strong> Entomology, doi: 10.1111/j.1461-9563.2011.00534.x
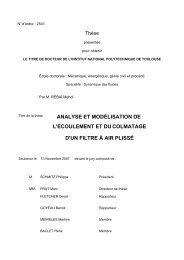
4 A. Roume et al.Table 1 Mean ± SD abundance, number of species and Shannon equitability index per trap in woodlot and op<strong>en</strong> habitat of each siteNumber of ground beetles Number of species Shannon equitability indexSite Woodlot Op<strong>en</strong> habitat Woodlot Op<strong>en</strong> habitat Woodlot Op<strong>en</strong> habitatW1-grass<strong>la</strong>nd 58.7 ± 14.2 67.8 ± 30.3 5.10 ± 1.21 11.80 ± 2.04 0.64 ± 0.18 0.79 ± 0.08W2-oilseed rape 53.1 ± 26.3 72.1 ± 50.6 3.45 ± 0.76 12.27 ± 2.49 0.54 ± 0.19 0.73 ± 0.14W11-soybean 66.9 ± 26.4 29.9 ± 11.8 5.40 ± 0.94 7.20 ± 2.04 0.67 ± 0.17 0.74 ± 0.12W13-wheat 32.1 ± 10.8 25.6 ± 8.9 3.95 ± 1.47 7.27 ± 2.22 0.52 ± 0.18 0.77 ± 0.14ABCanonical axis 2 (16.6%)-5 -3 -1 0 1Woodlots (n=70)Edges (n=20)Op<strong>en</strong> habitats (n=50)-5 -3 -1 0 1W1-grass<strong>la</strong>nd (n=35)W2-oilseed rape (n=35)W11-soybean (n=35)W13-wheat (n=35)-2 -1 0 1-2 -1 0 1Canonical axis 1 (22.7%)Figure 2 Correspond<strong>en</strong>ce analysis computed on all the traps used in the pres<strong>en</strong>t study. Traps were grouped in three c<strong>la</strong>sses according to their distancefrom boundary (‘edge’ repres<strong>en</strong>ts traps located 2.5 m from the boundary on both of its si<strong>des</strong>, ‘woodlot’ and ‘op<strong>en</strong> habitat’ d<strong>en</strong>ote the remaining trapsin the corresponding habitats; A) or according to the site in which they were located (B). Ellipses repres<strong>en</strong>t the main area occupied by each group, andare c<strong>en</strong>tred on the baryc<strong>en</strong>tre of this group.variables measured along the transects (used as predictorvariables). The scores of woodlot traps were extracted fromthe NCAP on woodlots and those of op<strong>en</strong> habitat traps wereextracted from the NCAP on op<strong>en</strong> habitats. Th<strong>en</strong>, a g<strong>en</strong>eralizedlinear model was computed separately on each of the four sitesafter having selected relevant predictor variables with a forwardstepwise method.The differ<strong>en</strong>t transects of each site were not used aspseudoreplicates but all traps were included simultaneouslyin the same model, for all analyses. All the analyses wereperformed using r software, version 2.8.1 (R Developm<strong>en</strong>tCore Team, 2008) and NCAP was performed using the author’scode (Mil<strong>la</strong>r, 2005).ResultsWe caught a total of 7145 ground beetles belonging to46 species during the trapping period. Within each site, theabundance of ground beetles was comparable in the woodlotand the adjac<strong>en</strong>t op<strong>en</strong> habitat, except for W11-oilseed rapewhere ground beetles in the woodlot were twice as abundantthan in the op<strong>en</strong> habitat (Stud<strong>en</strong>t’s t-t<strong>est</strong>, t = 5.6, P3andP2.7 andP2.1andP3.1 andP5andP3and P