Relazione semestrale 30 Giugno 2008 - Pioneer Investments
Relazione semestrale 30 Giugno 2008 - Pioneer Investments
Relazione semestrale 30 Giugno 2008 - Pioneer Investments

You also want an ePaper? Increase the reach of your titles
YUMPU automatically turns print PDFs into web optimized ePapers that Google loves.
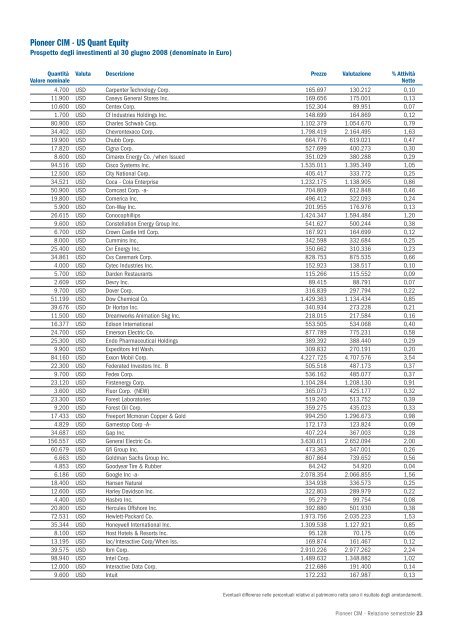
<strong>Pioneer</strong> CIM - US Quant Equity<br />
Prospetto degli investimenti al <strong>30</strong> giugno <strong>2008</strong> (denominato in Euro)<br />
Quantità Valuta Descrizione Prezzo Valutazione % Attività<br />
Valore nominale Nette<br />
4.700 USD Carpenter Technology Corp. 165.697 1<strong>30</strong>.212 0,10<br />
11.900 USD Caseys General Stores Inc. 169.656 175.001 0,13<br />
10.600 USD Centex Corp. 152.<strong>30</strong>4 89.951 0,07<br />
1.700 USD Cf Industries Holdings Inc. 148.699 164.869 0,12<br />
80.900 USD Charles Schwab Corp. 1.102.379 1.054.670 0,79<br />
34.402 USD Chevrontexaco Corp. 1.798.419 2.164.495 1,63<br />
19.900 USD Chubb Corp. 664.776 619.021 0,47<br />
17.820 USD Cigna Corp. 527.699 400.273 0,<strong>30</strong><br />
8.600 USD Cimarex Energy Co. /when Issued 351.029 380.288 0,29<br />
94.516 USD Cisco Systems Inc. 1.535.011 1.395.349 1,05<br />
12.500 USD City National Corp. 405.417 333.772 0,25<br />
34.521 USD Coca - Cola Enterprise 1.232.175 1.138.905 0,86<br />
50.900 USD Comcast Corp. -a- 704.809 612.848 0,46<br />
19.800 USD Comerica Inc. 496.412 322.093 0,24<br />
5.900 USD Con-Way Inc. 201.955 176.976 0,13<br />
26.615 USD Conocophillips 1.424.347 1.594.484 1,20<br />
9.600 USD Constellation Energy Group Inc. 541.627 500.244 0,38<br />
6.700 USD Crown Castle Intl Corp. 167.921 164.699 0,12<br />
8.000 USD Cummins Inc, 342.598 332.684 0,25<br />
25.400 USD Cvr Energy Inc. 350.662 310.336 0,23<br />
34.861 USD Cvs Caremark Corp. 828.753 875.535 0,66<br />
4.000 USD Cytec Industries Inc. 152.923 138.517 0,10<br />
5.700 USD Darden Restaurants 115.266 115.552 0,09<br />
2.609 USD Devry Inc. 89.415 88.791 0,07<br />
9.700 USD Dover Corp. 316.839 297.794 0,22<br />
51.199 USD Dow Chemical Co. 1.429.363 1.134.434 0,85<br />
39.676 USD Dr Horton Inc. 340.934 273.228 0,21<br />
11.500 USD Dreamworks Animation Skg Inc. 218.015 217.584 0,16<br />
16.377 USD Edison International 553.505 534.068 0,40<br />
24.700 USD Emerson Electric Co. 877.789 775.231 0,58<br />
25.<strong>30</strong>0 USD Endo Pharmaceutical Holdings 389.392 388.440 0,29<br />
9.900 USD Expeditors Intl Wash. <strong>30</strong>9.832 270.191 0,20<br />
84.160 USD Exxon Mobil Corp. 4.227.725 4.707.576 3,54<br />
22.<strong>30</strong>0 USD Federated Investors Inc. B 505.518 487.173 0,37<br />
9.700 USD Fedex Corp. 536.162 485.077 0,37<br />
23.120 USD Firstenergy Corp. 1.104.284 1.208.1<strong>30</strong> 0,91<br />
3.600 USD Fluor Corp. (NEW) 365.073 425.177 0,32<br />
23.<strong>30</strong>0 USD Forest Laboratories 519.240 513.752 0,39<br />
9.200 USD Forest Oil Corp. 359.275 435.023 0,33<br />
17.433 USD Freeport Mcmoran Copper & Gold 994.250 1.296.673 0,98<br />
4.829 USD Gamestop Corp -A- 172.173 123.824 0,09<br />
34.687 USD Gap Inc. 407.224 367.003 0,28<br />
156.557 USD General Electric Co. 3.6<strong>30</strong>.611 2.652.094 2,00<br />
60.679 USD Gfi Group Inc. 473.363 347.001 0,26<br />
6.663 USD Goldman Sachs Group Inc. 807.864 739.652 0,56<br />
4.853 USD Goodyear Tire & Rubber 84.242 54.920 0,04<br />
6.186 USD Google Inc -a- 2.078.354 2.066.855 1,56<br />
18.400 USD Hansen Natural 334.938 336.573 0,25<br />
12.600 USD Harley Davidson Inc. 322.803 289.979 0,22<br />
4.400 USD Hasbro Inc. 95.279 99.754 0,08<br />
20.800 USD Hercules Offshore Inc. 392.880 501.9<strong>30</strong> 0,38<br />
72.531 USD Hewlett-Packard Co. 1.973.756 2.035.223 1,53<br />
35.344 USD Honeywell International Inc. 1.<strong>30</strong>9.538 1.127.921 0,85<br />
8.100 USD Host Hotels & Resorts Inc. 95.128 70.175 0,05<br />
13.195 USD Iac/Interactive Corp/When Iss. 169.874 161.467 0,12<br />
39.575 USD Ibm Corp. 2.910.226 2.977.262 2,24<br />
98.940 USD Intel Corp. 1.489.632 1.348.882 1,02<br />
12.000 USD Interactive Data Corp. 212.686 191.400 0,14<br />
9.600 USD Intuit 172.232 167.987 0,13<br />
Eventuali differenze nelle percentuali relative al patrimonio netto sono il risultato degli arrotondamenti.<br />
<strong>Pioneer</strong> CIM - <strong>Relazione</strong> <strong>semestrale</strong> 23