Relazione semestrale 30 Giugno 2008 - Pioneer Investments
Relazione semestrale 30 Giugno 2008 - Pioneer Investments
Relazione semestrale 30 Giugno 2008 - Pioneer Investments

Create successful ePaper yourself
Turn your PDF publications into a flip-book with our unique Google optimized e-Paper software.
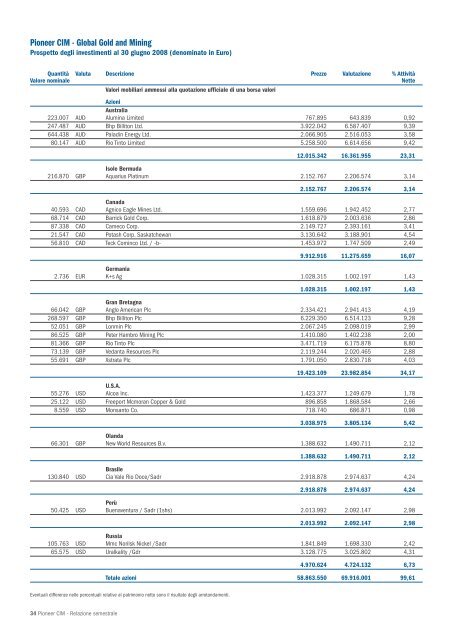
<strong>Pioneer</strong> CIM - Global Gold and Mining<br />
Prospetto degli investimenti al <strong>30</strong> giugno <strong>2008</strong> (denominato in Euro)<br />
Quantità Valuta Descrizione Prezzo Valutazione % Attività<br />
Valore nominale<br />
Valori mobiliari ammessi alla quotazione ufficiale di una borsa valori<br />
Nette<br />
Azioni<br />
Australia<br />
223.007 AUD Alumina Limited 767.895 643.839 0,92<br />
247.487 AUD Bhp Billiton Ltd. 3.922.042 6.587.407 9,39<br />
644.438 AUD Paladin Energy Ltd. 2.066.905 2.516.053 3,58<br />
80.147 AUD Rio Tinto Limited 5.258.500 6.614.656 9,42<br />
34 <strong>Pioneer</strong> CIM - <strong>Relazione</strong> <strong>semestrale</strong><br />
12.015.342 16.361.955 23,31<br />
Isole Bermuda<br />
216.870 GBP Aquarius Platinum 2.152.767 2.206.574 3,14<br />
2.152.767 2.206.574 3,14<br />
Canada<br />
40.593 CAD Agnico Eagle Mines Ltd. 1.559.696 1.942.452 2,77<br />
68.714 CAD Barrick Gold Corp. 1.618.879 2.003.636 2,86<br />
87.338 CAD Cameco Corp. 2.149.727 2.393.161 3,41<br />
21.547 CAD Potash Corp. Saskatchewan 3.1<strong>30</strong>.642 3.188.901 4,54<br />
56.810 CAD Teck Cominco Ltd. / -b- 1.453.972 1.747.509 2,49<br />
9.912.916 11.275.659 16,07<br />
Germania<br />
2.736 EUR K+s Ag 1.028.315 1.002.197 1,43<br />
1.028.315 1.002.197 1,43<br />
Gran Bretagna<br />
66.042 GBP Anglo American Plc 2.334.421 2.941.413 4,19<br />
268.597 GBP Bhp Billiton Plc 6.229.350 6.514.123 9,28<br />
52.051 GBP Lonmin Plc 2.067.245 2.098.019 2,99<br />
86.525 GBP Peter Hambro Mining Plc 1.410.080 1.402.238 2,00<br />
81.366 GBP Rio Tinto Plc 3.471.719 6.175.878 8,80<br />
73.139 GBP Vedanta Resources Plc 2.119.244 2.020.465 2,88<br />
55.691 GBP Xstrata Plc 1.791.050 2.8<strong>30</strong>.718 4,03<br />
19.423.109 23.982.854 34,17<br />
U.S.A.<br />
55.276 USD Alcoa Inc. 1.423.377 1.249.679 1,78<br />
25.122 USD Freeport Mcmoran Copper & Gold 896.858 1.868.584 2,66<br />
8.559 USD Monsanto Co. 718.740 686.871 0,98<br />
3.038.975 3.805.134 5,42<br />
Olanda<br />
66.<strong>30</strong>1 GBP New World Resources B.v. 1.388.632 1.490.711 2,12<br />
1.388.632 1.490.711 2,12<br />
Brasile<br />
1<strong>30</strong>.840 USD Cia Vale Rio Doce/Sadr 2.918.878 2.974.637 4,24<br />
2.918.878 2.974.637 4,24<br />
Perù<br />
50.425 USD Buenaventura / Sadr (1shs) 2.013.992 2.092.147 2,98<br />
2.013.992 2.092.147 2,98<br />
Russia<br />
105.763 USD Mmc Norilsk Nickel /Sadr 1.841.849 1.698.3<strong>30</strong> 2,42<br />
65.575 USD Uralkality /Gdr 3.128.775 3.025.802 4,31<br />
4.970.624 4.724.132 6,73<br />
Totale azioni 58.863.550 69.916.001 99,61<br />
Eventuali differenze nelle percentuali relative al patrimonio netto sono il risultato degli arrotondamenti.