à rsrapport 2005 - Tv2
à rsrapport 2005 - Tv2
à rsrapport 2005 - Tv2

Create successful ePaper yourself
Turn your PDF publications into a flip-book with our unique Google optimized e-Paper software.
INNHOLD<br />
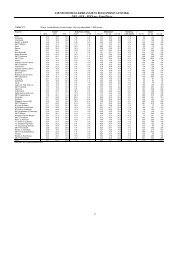
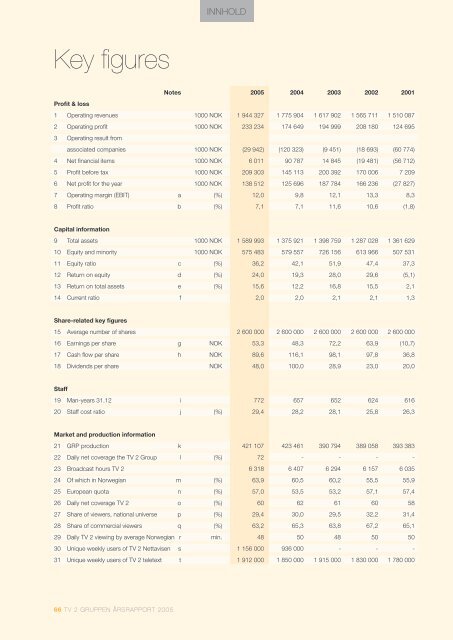
Key figures<br />
Notes <strong>2005</strong> 2004 2003 2002 2001<br />
Profit & loss<br />
1 Operating revenues 1000 NOK 1 944 327 1 775 904 1 617 902 1 565 711 1 510 087<br />
2 Operating profit 1000 NOK 233 234 174 649 194 999 208 180 124 695<br />
3 Operating result from<br />
associated companies 1000 NOK (29 942) (120 323) (9 451) (18 693) (60 774)<br />
4 Net financial items 1000 NOK 6 011 90 787 14 845 (19 481) (56 712)<br />
5 Profit before tax 1000 NOK 209 303 145 113 200 392 170 006 7 209<br />
6 Net profit for the year 1000 NOK 138 512 125 696 187 784 166 236 (27 827)<br />
7 Operating margin (EBIT) a (%) 12,0 9,8 12,1 13,3 8,3<br />
8 Profit ratio b (%) 7,1 7,1 11,6 10,6 (1,8)<br />
Capital information<br />
9 Total assets 1000 NOK 1 589 993 1 375 921 1 398 759 1 287 028 1 361 629<br />
10 Equity and minority 1000 NOK 575 483 579 557 726 156 613 966 507 531<br />
11 Equity ratio c (%) 36,2 42,1 51,9 47,4 37,3<br />
12 Return on equity d (%) 24,0 19,3 28,0 29,6 (5,1)<br />
13 Return on total assets e (%) 15,6 12,2 16,8 15,5 2,1<br />
14 Current ratio f 2,0 2,0 2,1 2,1 1,3<br />
Share-related key figures<br />
15 Average number of shares 2 600 000 2 600 000 2 600 000 2 600 000 2 600 000<br />
16 Earnings per share g NOK 53,3 48,3 72,2 63,9 (10,7)<br />
17 Cash flow per share h NOK 89,6 116,1 98,1 97,8 36,8<br />
18 Dividends per share NOK 48,0 100,0 28,9 23,0 20,0<br />
Staff<br />
19 Man-years 31.12 i 772 657 652 624 616<br />
20 Staff cost ratio j (%) 29,4 28,2 28,1 25,8 26,3<br />
Market and production information<br />
21 GRP production k 421 107 423 461 390 794 389 058 393 383<br />
22 Daily net coverage the TV 2 Group l (%) 72 - - - -<br />
23 Broadcast hours TV 2 6 318 6 407 6 294 6 157 6 035<br />
24 Of which in Norwegian m (%) 63,9 60,5 60,2 55,5 55,9<br />
25 European quota n (%) 57,0 53,5 53,2 57,1 57,4<br />
26 Daily net coverage TV 2 o (%) 60 62 61 60 58<br />
27 Share of viewers, national universe p (%) 29,4 30,0 29,5 32,2 31,4<br />
28 Share of commercial viewers q (%) 63,2 65,3 63,8 67,2 65,1<br />
29 Daily TV 2 viewing by average Norwegian r min. 48 50 48 50 50<br />
30 Unique weekly users of TV 2 Nettavisen s 1 156 000 936 000 - - -<br />
31 Unique weekly users of TV 2 teletext t 1 912 000 1 850 000 1 915 000 1 830 000 1 780 000<br />
66 TV 2 GRUPPEN ÅRSRAPPORT <strong>2005</strong>