à rsrapport 2005 - Tv2
à rsrapport 2005 - Tv2
à rsrapport 2005 - Tv2

Create successful ePaper yourself
Turn your PDF publications into a flip-book with our unique Google optimized e-Paper software.
INNHOLD<br />
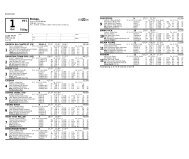
Notes<br />
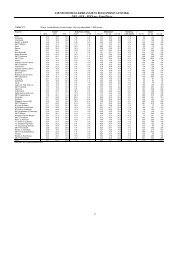
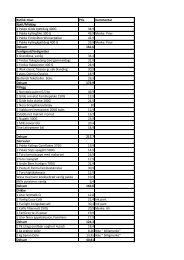
a Operating profit / Operating revenues<br />
b Net profit for the year / Operating revenues<br />
c Equity and minority / Total assets<br />
d Net profit for the year / Average equity<br />
e (Profit before tax + interest expenses) / Average total assets<br />
f Current assets / Current liabilities<br />
g Net profit for the year / Average number of shares<br />
h (Profit before tax + depreciation +/- changes in pension commitments +/- result and dividends from associated companies<br />
– tax payable) / Average number of shares<br />
i Includes man-years from cos. where the TV 2 Group owns at least 50 per cent<br />
j Staff cost / Operating revenues<br />
k GRP = Gross Rating Points. 1 GRP corresponds to a 1 % rating, ie 36 480 viewers<br />
l Describes the average proportion of the population over the age of 13 using one or more product of the TV 2 Group on a daily basis.<br />
m The proportion of Norwegian language programmes in TV 2’s programme mix<br />
n The proportion of European productions in a programme mix which excludes news, sports and game shows<br />
o Describes the average proportion of the population over the age of 13 using TV 2 on a daily basis.<br />
Source: TNS Gallup Forbruker & Media <strong>2005</strong>/2<br />
p “National universe” describes that part of the population over the age of 12 that has access to television.<br />
Source: TNS Gallup TV-meter-panel<br />
q Describes TV 2s proportion of total viewing time spent on the three commercial channels TV 2, TVNorge and TV3.<br />
Source: TNS Gallup TV-meter-panel<br />
r Source: TNS Gallup TV-meter-panel<br />
s Source: TNS Gallup Forbruker & Media <strong>2005</strong>/2<br />
t Source: TNS Gallup<br />
TV 2 GRUPPEN ÅRSRAPPORT <strong>2005</strong> 67