Avaliação de percepção da qualidade dos serviços ... - Faccamp
Avaliação de percepção da qualidade dos serviços ... - Faccamp
Avaliação de percepção da qualidade dos serviços ... - Faccamp

Create successful ePaper yourself
Turn your PDF publications into a flip-book with our unique Google optimized e-Paper software.
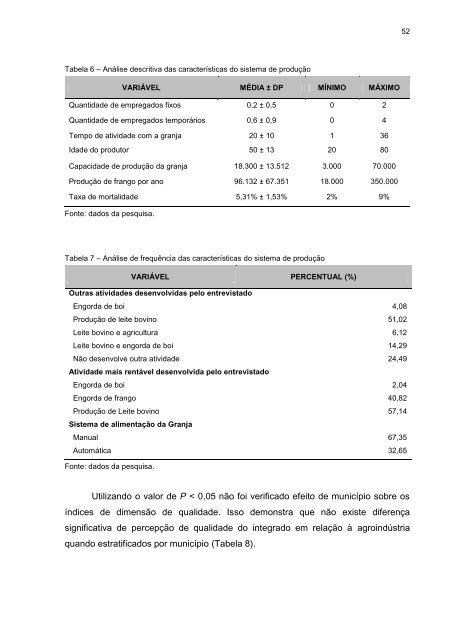
Tabela 6 ‒ Análise <strong>de</strong>scritiva <strong>da</strong>s características do sistema <strong>de</strong> produção<br />
VARIÁVEL MÉDIA ± DP MÍNIMO MÁXIMO<br />
Quanti<strong>da</strong><strong>de</strong> <strong>de</strong> emprega<strong>dos</strong> fixos 0,2 ± 0,5 0 2<br />
Quanti<strong>da</strong><strong>de</strong> <strong>de</strong> emprega<strong>dos</strong> temporários 0,6 ± 0,9 0 4<br />
Tempo <strong>de</strong> ativi<strong>da</strong><strong>de</strong> com a granja 20 ± 10 1 36<br />
I<strong>da</strong><strong>de</strong> do produtor 50 ± 13 20 80<br />
Capaci<strong>da</strong><strong>de</strong> <strong>de</strong> produção <strong>da</strong> granja 18.300 ± 13.512 3.000 70.000<br />
Produção <strong>de</strong> frango por ano 96.132 ± 67.351 18.000 350.000<br />
Taxa <strong>de</strong> mortali<strong>da</strong><strong>de</strong> 5,31% ± 1,53% 2% 9%<br />
Fonte: <strong>da</strong><strong>dos</strong> <strong>da</strong> pesquisa.<br />
Tabela 7 ‒ Análise <strong>de</strong> frequência <strong>da</strong>s características do sistema <strong>de</strong> produção<br />
VARIÁVEL PERCENTUAL (%)<br />
Outras ativi<strong>da</strong><strong>de</strong>s <strong>de</strong>senvolvi<strong>da</strong>s pelo entrevistado<br />
Engor<strong>da</strong> <strong>de</strong> boi 4,08<br />
Produção <strong>de</strong> leite bovino 51,02<br />
Leite bovino e agricultura 6,12<br />
Leite bovino e engor<strong>da</strong> <strong>de</strong> boi 14,29<br />
Não <strong>de</strong>senvolve outra ativi<strong>da</strong><strong>de</strong> 24,49<br />
Ativi<strong>da</strong><strong>de</strong> mais rentável <strong>de</strong>senvolvi<strong>da</strong> pelo entrevistado<br />
Engor<strong>da</strong> <strong>de</strong> boi 2,04<br />
Engor<strong>da</strong> <strong>de</strong> frango 40,82<br />
Produção <strong>de</strong> Leite bovino 57,14<br />
Sistema <strong>de</strong> alimentação <strong>da</strong> Granja<br />
Manual 67,35<br />
Automática 32,65<br />
Fonte: <strong>da</strong><strong>dos</strong> <strong>da</strong> pesquisa.<br />
Utilizando o valor <strong>de</strong> P < 0,05 não foi verificado efeito <strong>de</strong> município sobre os<br />
índices <strong>de</strong> dimensão <strong>de</strong> quali<strong>da</strong><strong>de</strong>. Isso <strong>de</strong>monstra que não existe diferença<br />
significativa <strong>de</strong> <strong>percepção</strong> <strong>de</strong> quali<strong>da</strong><strong>de</strong> do integrado em relação à agroindústria<br />
quando estratifica<strong>dos</strong> por município (Tabela 8).<br />
52