209 CUPRINS
209 CUPRINS
209 CUPRINS

Create successful ePaper yourself
Turn your PDF publications into a flip-book with our unique Google optimized e-Paper software.
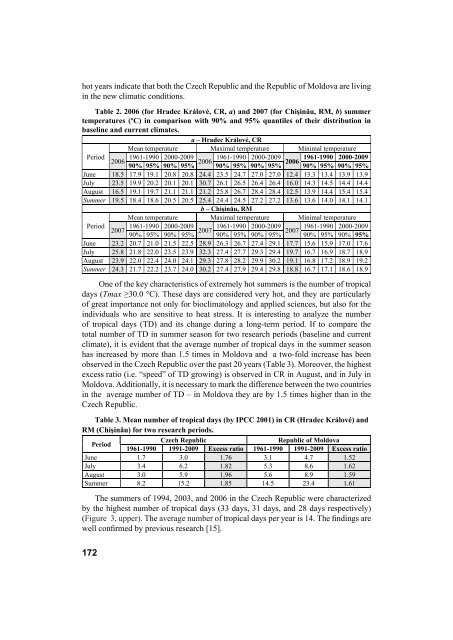
hot years indicate that both the Czech Republic and the Republic of Moldova are living<br />
in the new climatic conditions.<br />
Table 2. 2006 (for Hradec Králové, CR, a) and 2007 (for Chişinău, RM, b) summer<br />
temperatures (ºC) in comparison with 90% and 95% quantiles of their distribution in<br />
baseline and current climates.<br />
a – Hradec Králové, CR<br />
Mean temperature Maximal temperature Minimal temperature<br />
Period<br />
2006 1961-1990 2000-2009 2006 1961-1990 2000-2009 1961-1990 2000-2009<br />
2006<br />
90% 95% 90% 95% 90% 95% 90% 95% 90% 95% 90% 95%<br />
June 18.5 17.9 19.1 20.8 20.8 24.4 23.5 24.7 27.0 27.0 12.4 13.3 13.4 13.9 13.9<br />
July 23.5 19.9 20.2 20.1 20.1 30.7 26.1 26.5 26.4 26.4 16.0 14.3 14.5 14.4 14.4<br />
August 16.5 19.1 19.7 21.1 21.1 21.2 25.8 26.7 28.4 28.4 12.5 13.9 14.4 15.4 15.4<br />
Summer 19.5 18.4 18.6 20.5 20.5 25.4 24.4 24.5 27.2 27.2 13.6 13.6 14.0 14.1 14.1<br />
Mean temperature<br />
b – Chişinău, RM<br />
Maximal temperature Minimal temperature<br />
Period<br />
2007 1961-1990 2000-2009 2007 1961-1990 2000-2009 1961-1990 2000-2009<br />
2007<br />
90% 95% 90% 95% 90% 95% 90% 95% 90% 95% 90% 95%<br />
June 23.2 20.7 21.0 21.5 22.5 28.9 26.3 26.7 27.4 29.1 17.7 15.6 15.9 17.0 17.6<br />
July 25.8 21.8 22.0 23.5 23.9 32.3 27.4 27.7 29.3 29.4 19.7 16.7 16.9 18.7 18.9<br />
August 23.9 22.0 22.4 24.0 24.1 29.3 27.8 28.2 29.9 30.2 19.1 16.8 17.2 18.9 19.2<br />
Summer 24.3 21.7 22.2 23.7 24.0 30.2 27.4 27.9 29.4 29.8 18.8 16.7 17.1 18.6 18.9<br />
One of the key characteristics of extremely hot summers is the number of tropical<br />
days (Tmax ≥30.0 °C). These days are considered very hot, and they are particularly<br />
of great importance not only for bioclimatology and applied sciences, but also for the<br />
individuals who are sensitive to heat stress. It is interesting to analyze the number<br />
of tropical days (TD) and its change during a long-term period. If to compare the<br />
total number of TD in summer season for two research periods (baseline and current<br />
climate), it is evident that the average number of tropical days in the summer season<br />
has increased by more than 1.5 times in Moldova and a two-fold increase has been<br />
observed in the Czech Republic over the past 20 years (Table 3). Moreover, the highest<br />
excess ratio (i.e. “speed” of TD growing) is observed in CR in August, and in July in<br />
Moldova. Additionally, it is necessary to mark the difference between the two countries<br />
in the average number of TD – in Moldova they are by 1.5 times higher than in the<br />
Czech Republic.<br />
Table 3. Mean number of tropical days (by IPCC 2001) in CR (Hradec Králové) and<br />
RM (Chişinău) for two research periods.<br />
Period<br />
1961-1990<br />
Czech Republic<br />
1991-2009 Excess ratio<br />
Republic of Moldova<br />
1961-1990 1991-2009 Excess ratio<br />
June 1.7 3.0 1.76 3.1 4.7 1.52<br />
July 3.4 6.2 1.82 5.3 8.6 1.62<br />
August 3.0 5.9 1.96 5.6 8.9 1.59<br />
Summer 8.2 15.2 1.85 14.5 23.4 1.61<br />
The summers of 1994, 2003, and 2006 in the Czech Republic were characterized<br />
by the highest number of tropical days (33 days, 31 days, and 28 days respectively)<br />
(Figure 3, upper). The average number of tropical days per year is 14. The ndings are<br />
well con rmed by previous research [15].<br />
172