CLTA Newsletter September 2022

You also want an ePaper? Increase the reach of your titles
YUMPU automatically turns print PDFs into web optimized ePapers that Google loves.
number of higher educational institutions.<br />
What is striking to me is that in reviewing <strong>CLTA</strong> conference programs from<br />
over the last 35 years, dating back to 1997 (the earliest for which records are<br />
available at the <strong>CLTA</strong> website), there has been a clear quantitative decline in the<br />
nonnative “presence” among the paper presenters, panelists, and discussants. The<br />
advantage of having attended the conference since 1986 (!) is that the names are<br />
very familiar to me, and I know who among them are the nonnative speakers with<br />
some degree of confidence.<br />
Conference year Total presenters/ Nonna5ve Chinese Percentage of<br />
panelists/discussants presenters nonna5ve Chinese<br />
1997 127 15 11.8%<br />
2002 92 10 10.7%<br />
2012 223 10 4.5%<br />
<strong>2022</strong> 348 13 3.7%<br />
(retrieved from https://www.clta-us.org/meeting/program-archives/)<br />
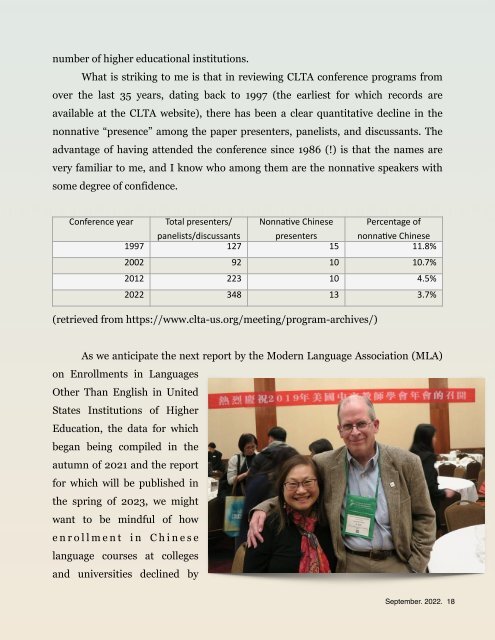
As we anticipate the next report by the Modern Language Association (MLA)<br />
on Enrollments in Languages<br />
Other Than English in United<br />
States Institutions of Higher<br />
Education, the data for which<br />
began being compiled in the<br />
autumn of 2021 and the report<br />
for which will be published in<br />
the spring of 2023, we might<br />
want to be mindful of how<br />
enrollment in Chinese<br />
language courses at colleges<br />
and universities declined by<br />
<strong>September</strong>. <strong>2022</strong>. 18