Simulering af energiforsyningen i Sarfannguaq - Clim-ATIC
Simulering af energiforsyningen i Sarfannguaq - Clim-ATIC
Simulering af energiforsyningen i Sarfannguaq - Clim-ATIC

Create successful ePaper yourself
Turn your PDF publications into a flip-book with our unique Google optimized e-Paper software.
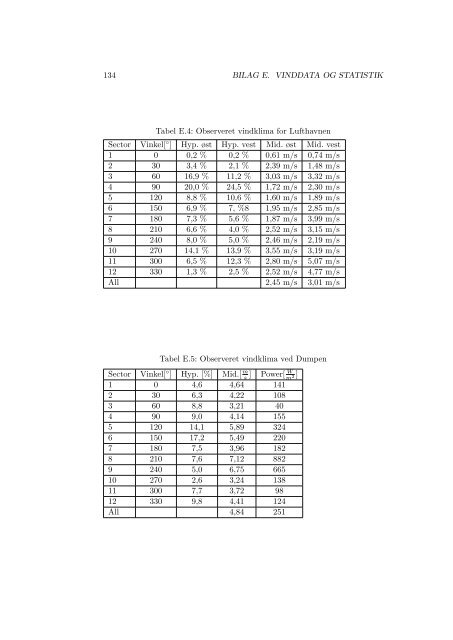
134 BILAG E. VINDDATA OG STATISTIK<br />
Tabel E.4: Observeret vindklima for Lufthavnen<br />
Sector Vinkel[ ◦ ] Hyp. øst Hyp. vest Mid. øst Mid. vest<br />
1 0 0,2 % 0,2 % 0,61 m/s 0,74 m/s<br />
2 30 3,4 % 2,1 % 2,39 m/s 1,48 m/s<br />
3 60 16,9 % 11,2 % 3,03 m/s 3,32 m/s<br />
4 90 20,0 % 24,5 % 1,72 m/s 2,30 m/s<br />
5 120 8,8 % 10,6 % 1,60 m/s 1,89 m/s<br />
6 150 6,9 % 7, %8 1,95 m/s 2,85 m/s<br />
7 180 7,3 % 5,6 % 1,87 m/s 3,99 m/s<br />
8 210 6,6 % 4,0 % 2,52 m/s 3,15 m/s<br />
9 240 8,0 % 5,0 % 2,46 m/s 2,19 m/s<br />
10 270 14,1 % 13,9 % 3,55 m/s 3,19 m/s<br />
11 300 6,5 % 12,3 % 2,80 m/s 5,07 m/s<br />
12 330 1,3 % 2,5 % 2,52 m/s 4,77 m/s<br />
All 2,45 m/s 3,01 m/s<br />
Tabel E.5: Observeret vindklima ved Dumpen<br />
Sector Vinkel[ ◦ ] Hyp. [%] Mid.[ m<br />
s ] W Power[ m2 1 0 4,6 4,64<br />
]<br />
141<br />
2 30 6,3 4,22 108<br />
3 60 8,8 3,21 40<br />
4 90 9,0 4,14 155<br />
5 120 14,1 5,89 324<br />
6 150 17,2 5,49 220<br />
7 180 7,5 3,96 182<br />
8 210 7,6 7,12 882<br />
9 240 5,0 6,75 665<br />
10 270 2,6 3,24 138<br />
11 300 7,7 3,72 98<br />
12 330 9,8 4,41 124<br />
All 4,84 251