% v/ vSektion O 2 N 2 CH 4 CO 2Sektion 1 # 1 7,7 80,0 0,0 14,4Sektion 1 # 2 7,2 78,9 0,0 14,7Sektion 1 7,5 79,5 0,0 14,6Sektion 2 # 1Sektion 2 # 2 2,7 74,9 5,9 18,0Sektion 2 2,7 74,9 5,9 18,0Sektion 3 # 1 5,0 74,7 4,3 17,4Sektion 3 # 2 5,1 74,1 4,2 17,0Sektion 3 5,1 74,4 4,3 17,2Sektion 4 # 1 0,0 38,2 34,6 28,1Sektion 4 # 2 0,0 39,0 34,4 27,9Sektion 4 0,0 38,6 34,5 28,0Sektion 5 # 1 18,9 76,7 0,2 4,5Sektion 5 # 2 19,3 77,6 0,1 4,2Sektion 5 19,1 77,2 0,2 4,4Sektion 6 # 1 17,3 78,4 0,1 3,7Sektion 6 # 2 17,5 78,5 0,0 3,5Sektion 6 17,4 78,5 0,1 3,6Sektion 7 # 1 2,2 65,2 12,5 21,2Sektion 7 # 2 2,8 65,5 12,2 20,7Sektion 7 2,5 65,4 12,4 21,0Sektion 8 # 1 18,6 78,2 0,4 4,0Sektion 8 # 2 18,4 77,0 0,4 3,8Sektion 8 18,5 77,6 0,4 3,9Sektion 9 # 1 1,1 67,3 11,2 20,3Sektion 9 # 2 0,8 67,7 11,3 20,6Sektion 9 1,0 67,5 11,3 20,5Tabel 2.4. Gassammensætning i sektion 1-9 d. 6. maj 2010.126
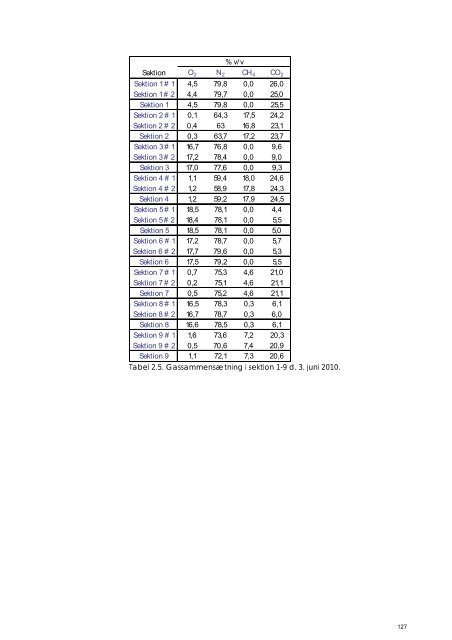
% v/ vSektion O 2 N 2 CH 4 CO 2Sektion 1 # 1 4,5 79,8 0,0 26,0Sektion 1 # 2 4,4 79,7 0,0 25,0Sektion 1 4,5 79,8 0,0 25,5Sektion 2 # 1 0,1 64,3 17,5 24,2Sektion 2 # 2 0,4 63 16,8 23,1Sektion 2 0,3 63,7 17,2 23,7Sektion 3 # 1 16,7 76,8 0,0 9,6Sektion 3 # 2 17,2 78,4 0,0 9,0Sektion 3 17,0 77,6 0,0 9,3Sektion 4 # 1 1,1 59,4 18,0 24,6Sektion 4 # 2 1,2 58,9 17,8 24,3Sektion 4 1,2 59,2 17,9 24,5Sektion 5 # 1 18,5 78,1 0,0 4,4Sektion 5 # 2 18,4 78,1 0,0 5,5Sektion 5 18,5 78,1 0,0 5,0Sektion 6 # 1 17,2 78,7 0,0 5,7Sektion 6 # 2 17,7 79,6 0,0 5,3Sektion 6 17,5 79,2 0,0 5,5Sektion 7 # 1 0,7 75,3 4,6 21,0Sektion 7 # 2 0,2 75,1 4,6 21,1Sektion 7 0,5 75,2 4,6 21,1Sektion 8 # 1 16,5 78,3 0,3 6,1Sektion 8 # 2 16,7 78,7 0,3 6,0Sektion 8 16,6 78,5 0,3 6,1Sektion 9 # 1 1,6 73,6 7,2 20,3Sektion 9 # 2 0,5 70,6 7,4 20,9Sektion 9 1,1 72,1 7,3 20,6Tabel 2.5. Gassammensætning i sektion 1-9 d. 3. juni 2010.127
- Page 2:
Miljøstyrelsen vil, når lejlighed
- Page 6:
ForordDenne rapport udgør afrappor
- Page 9 and 10:
(stabile) forhold målt til ca. 96
- Page 11 and 12:
Summary and conclusionsThe biocover
- Page 13 and 14:
declining atmospheric pressure. The
- Page 15 and 16:
1.2 Biocoverprojekt på KlintholmEf
- Page 17 and 18:
Med formålet at undersøge horison
- Page 19 and 20:
2 Kort beskrivelse af deponi påKli
- Page 21 and 22:
3.2 GasproduktionEtape 0I 1998 er g
- Page 23 and 24:
Svært omsætteligt affald360Totale
- Page 25 and 26:
4 Eksisterende metanemission(”bas
- Page 27 and 28:
Figur 4.3. Princippet i bestemmelse
- Page 29 and 30:
4.1.4 Måling af totalemissionDen t
- Page 31 and 32:
varierende fra mellem 25 ppmv til o
- Page 33 and 34:
EPS1 16002 3 80013 120014 22015 251
- Page 35 and 36:
Resultaterne af sporstofmålingerne
- Page 37 and 38:
4.5 Måling af horisontal gastransp
- Page 39 and 40:
4.6 Metanemissionsmålinger - samle
- Page 41 and 42:
Tabel 5.1. Oversigt over sammensæt
- Page 43 and 44:
5.3.2 Potentialet for metanoxidatio
- Page 45 and 46:
Blanding af havepark_15/10Køkken_1
- Page 47 and 48:
Tabel 5.5. Metanoxidationsrater må
- Page 49 and 50:
Figur 6.2. Render med punktvis kont
- Page 51 and 52:
Figur 6.5. Plantegning af etape 0.F
- Page 53 and 54:
Figur 6.8. Placering af sporstoffla
- Page 55 and 56:
Aktivitet20/1 11/16/1018/2 10/3 7/4
- Page 57 and 58:
7.1.1 Opsætning og funktion af dat
- Page 59 and 60:
Ved prøvetagningen starter man ved
- Page 61 and 62:
Figur 7.6. Fluxmåling ved site 2 d
- Page 63 and 64:
erfaringer, blevet valgt som den fo
- Page 65 and 66: løbet af moniteringsperiden, har b
- Page 67 and 68: Vandindhold - Datalogger A0,800100,
- Page 69 and 70: AtmosfæretrykAtmosfæretryk1030103
- Page 71 and 72: 7.4 Gassammensætning over dybden i
- Page 73 and 74: Gasprofiler - Site 2% v/ v % v/ v06
- Page 75 and 76: Figur 7.13. Billedcollage af biocov
- Page 77 and 78: Figur 7.16. Illustration af vegetat
- Page 79 and 80: skrænten. Det samme ser ud til at
- Page 81 and 82: 160Methanoxidationsrate (ug/g/t)140
- Page 83 and 84: Når man skal vurdere biocoversyste
- Page 85 and 86: Omkostninger til etablering af bioc
- Page 87 and 88: 9 FormidlingProjektets resultater o
- Page 89 and 90: I projektet er der endvidere observ
- Page 91 and 92: De samlede udgifter til moniterings
- Page 93 and 94: Pedersen GB, Scheutz C, Pedicone, A
- Page 95 and 96: Figur 1.2. Illustration af FID-scre
- Page 97 and 98: Bilag B1 VejrdataDette bilag indeho
- Page 99 and 100: Atmosfæretryk10251020Tryk / mbar10
- Page 101 and 102: Atmosfæretryk10301025Tryk / mbar10
- Page 103 and 104: Atmosfæretryk10301025Tryk / mbar10
- Page 105 and 106: Bilag C1 Gasprofiler i BiocoverDett
- Page 107 and 108: Gasprofiler - Site 2% v/ v % v/ v06
- Page 109 and 110: Gasprofiler - Site 6% v/ v % v/ v06
- Page 111 and 112: Gasprofiler - Site 10% v/ v % v/ v0
- Page 113 and 114: Bilag D1 Gassammensætning igasford
- Page 115: % v/ vsektion O 2 N 2 CH 4 CO 2Sekt
- Page 119 and 120: Gasfordelingslaget - 6. maj 2010Gas
- Page 121 and 122: 5 RenpumpningsforsøgRørSektion 6.
- Page 123 and 124: Bilag E1 FluxmålingerI dette bilag
- Page 125 and 126: 3 Fluxmålinger - gridmålinger ise
- Page 127 and 128: 4 Øvrige fluxmålinger4.1 Måleser
- Page 129 and 130: Bilag F1 Totalmålinger, Klintholmd
- Page 131 and 132: operated at 400 m downwind distance
- Page 133 and 134: Table 2. Summary for the CH 4 measu
- Page 135 and 136: Figur 1. Estimeret gasproduktion fo
- Page 137 and 138: 1998 forudsætninger1.400Totale gas
- Page 139 and 140: Sammenligning af gasproduktion2.500
- Page 141 and 142: Bilag 1Inddeling af etaper på Klin
- Page 143 and 144: Bilag 2Beregninger og graferRef 087
- Page 145 and 146: Graf for den totale gasproduktion p
- Page 147 and 148: Svært omsætteligt affald360Totale
- Page 163 and 164: 1 Estimeret gasproduktion påetape
- Page 165 and 166: Prognose af CH 4 produktionen, etap
- Page 167 and 168:
Prognose af CH 4 produktion, etape