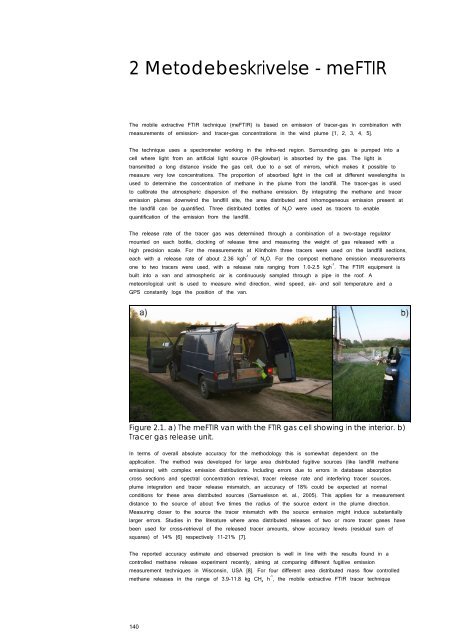
2 Metodebeskrivelse - meFTIRThe mobile extractive FTIR technique (meFTIR) is based on emission of tracer-gas in combination withmeasurements of emission- and tracer-gas concentrations in the wind plume [1, 2, 3, 4, 5].The technique uses a spectrometer working in the infra-red region. Surrounding gas is pumped into acell where light from an artificial light source (IR-glowbar) is absorbed by the gas. The light istransmitted a long distance inside the gas cell, due to a set of mirrors, which makes it possible tomeasure very low concentrations. The proportion of absorbed light in the cell at different wavelengths isused to determine the concentration of methane in the plume from the landfill. The tracer-gas is usedto calibrate the atmospheric dispersion of the methane emission. By integrating the methane and traceremission plumes downwind the landfill site, the area distributed and inhomogeneous emission present atthe landfill can be quantified. Three distributed bottles of N 2 O were used as tracers to enablequantification of the emission from the landfill.The release rate of the tracer gas was determined through a combination of a two-stage regulatormounted on each bottle, clocking of release time and measuring the weight of gas released with ahigh precision scale. For the measurements at Klintholm three tracers were used on the landfill sections,each with a release rate of about 2.36 kgh -1 of N 2 O. For the compost methane emission measurementsone to two tracers were used, with a release rate ranging from 1.0-2.5 kgh -1 . The FTIR equipment isbuilt into a van and atmospheric air is continuously sampled through a pipe in the roof. Ameteorological unit is used to measure wind direction, wind speed, air- and soil temperature and aGPS constantly logs the position of the van.Figure 2.1. a) The meFTIR van with the FTIR gas cell showing in the interior. b)Tracer gas release unit.In terms of overall absolute accuracy for the methodology this is somewhat dependent on theapplication. The method was developed for large area distributed fugitive sources (like landfill methaneemissions) with complex emission distributions. Including errors due to errors in database absorptioncross sections and spectral concentration retrieval, tracer release rate and interfering tracer sources,plume integration and tracer release mismatch, an accuracy of 18% could be expected at normalconditions for these area distributed sources (Samuelsson et. al., 2005). This applies for a measurementdistance to the source of about five times the radius of the source extent in the plume direction.Measuring closer to the source the tracer mismatch with the source emission might induce substantiallylarger errors. Studies in the literature where area distributed releases of two or more tracer gases havebeen used for cross-retrieval of the released tracer amounts, show accuracy levels (residual sum ofsquares) of 14% [6] respectively 11-21% [7].The reported accuracy estimate and observed precision is well in line with the results found in acontrolled methane release experiment recently, aiming at comparing different fugitive emissionmeasurement techniques in Wisconsin, USA [8]. For four different area distributed mass flow controlledmethane releases in the range of 3.9-11.8 kg CH 4 h -1 , the mobile extractive FTIR tracer technique140
operated at 400 m downwind distance, retrieved the fluxes with an absolute accuracy within 4-20 % forthe four different configurations. The precision for the measurements in this experiment was in the range4-9 %.2.1 References[1] Galle B, Samuelsson J, Svensson BH, Börjesson G.,. Measurements of methane emissions fromlandfills using a time correlation tracer method based on FTIR absorption spectroscopy. EnvironmentalScience & Technology 35 (1): 21-25, 2001.[2] Samuelsson, J., Börjesson, G., Svensson, B., Galle, B., Metan från avfallsupplag i Sverige (Methanefrom landfills in Sweden), final report to the Swedish Energy Agency, projekt nr P10856-4, December2005. In Swedish (www.stem.se), can be ordered from Studsviksbiblioteket, 61182Nyköping, Sweden,www.lib.kth.se/SB/service/stemavf.html.[3] Samuelsson, J., Börjesson, G., Monitoring of methane emissions from landfills using tracers andmobile FTIR spectroscopy, Proceedings CEM2007, 8 th International Conference on Emissions Monitoring,Zürich, 2007, pp 169-173.[4] Scheutz, C., Samuelsson, J., Fredenslund, A.M., Kjeldsen, P., Methane emission quantification fromlandfills using a double tracer approach, Proceedings Sardinia 2007, Eleventh International WasteManagement and Landfill Symposium, CISA publisher, Cagliari, 2007.[5] Börjesson, G., Samuelsson, J., A national landfill methane budget for Sweden based on fieldmeasurements, and an evaluation of IPCC models. Accepted for publication in Tellus series B –Chemical and Physical Meteorology, 61(2) 424-435, 2009[6] Mellqvist, J., Application of infrared and UV-visible remote sensing techniques for studying thestratosphere and for estimating anthropogenic emissions, doktorsavhandling, Chalmers tekniska högskola,Göteborg, Sweden, 1999[7] Lamb, B., J. McManus, Joanne Shorter, Charles Kolb, Byard Mosher, Robert Harriss, Eugene Allwine,Denise Blaha, Touche Howard, Alex Guenther, Robert Lott, Robert Siverson, Hal Westburg, PatZimmerman (1995). "Development of Atmospheric Tracer Methods To Measure Methane Emissions fromNatural Gas Facilities and Urban Areas." Environ. Sci. Technol. 29(6): 1468-1479.[8] Babilotte, A., Green, R., Hater, G., Watermolen, T., Staley, B., 2009, Field intercomparison ofmethods to measure fugitive methane emissions. Proceedings Sardinia 09 Twelfth International WasteManagement and Landfill Symposium, CISA Environmental Sanitary Engineering Centre,Cagliari, Italy.141
- Page 2:
Miljøstyrelsen vil, når lejlighed
- Page 6:
ForordDenne rapport udgør afrappor
- Page 9 and 10:
(stabile) forhold målt til ca. 96
- Page 11 and 12:
Summary and conclusionsThe biocover
- Page 13 and 14:
declining atmospheric pressure. The
- Page 15 and 16:
1.2 Biocoverprojekt på KlintholmEf
- Page 17 and 18:
Med formålet at undersøge horison
- Page 19 and 20:
2 Kort beskrivelse af deponi påKli
- Page 21 and 22:
3.2 GasproduktionEtape 0I 1998 er g
- Page 23 and 24:
Svært omsætteligt affald360Totale
- Page 25 and 26:
4 Eksisterende metanemission(”bas
- Page 27 and 28:
Figur 4.3. Princippet i bestemmelse
- Page 29 and 30:
4.1.4 Måling af totalemissionDen t
- Page 31 and 32:
varierende fra mellem 25 ppmv til o
- Page 33 and 34:
EPS1 16002 3 80013 120014 22015 251
- Page 35 and 36:
Resultaterne af sporstofmålingerne
- Page 37 and 38:
4.5 Måling af horisontal gastransp
- Page 39 and 40:
4.6 Metanemissionsmålinger - samle
- Page 41 and 42:
Tabel 5.1. Oversigt over sammensæt
- Page 43 and 44:
5.3.2 Potentialet for metanoxidatio
- Page 45 and 46:
Blanding af havepark_15/10Køkken_1
- Page 47 and 48:
Tabel 5.5. Metanoxidationsrater må
- Page 49 and 50:
Figur 6.2. Render med punktvis kont
- Page 51 and 52:
Figur 6.5. Plantegning af etape 0.F
- Page 53 and 54:
Figur 6.8. Placering af sporstoffla
- Page 55 and 56:
Aktivitet20/1 11/16/1018/2 10/3 7/4
- Page 57 and 58:
7.1.1 Opsætning og funktion af dat
- Page 59 and 60:
Ved prøvetagningen starter man ved
- Page 61 and 62:
Figur 7.6. Fluxmåling ved site 2 d
- Page 63 and 64:
erfaringer, blevet valgt som den fo
- Page 65 and 66:
løbet af moniteringsperiden, har b
- Page 67 and 68:
Vandindhold - Datalogger A0,800100,
- Page 69 and 70:
AtmosfæretrykAtmosfæretryk1030103
- Page 71 and 72:
7.4 Gassammensætning over dybden i
- Page 73 and 74:
Gasprofiler - Site 2% v/ v % v/ v06
- Page 75 and 76:
Figur 7.13. Billedcollage af biocov
- Page 77 and 78:
Figur 7.16. Illustration af vegetat
- Page 79 and 80: skrænten. Det samme ser ud til at
- Page 81 and 82: 160Methanoxidationsrate (ug/g/t)140
- Page 83 and 84: Når man skal vurdere biocoversyste
- Page 85 and 86: Omkostninger til etablering af bioc
- Page 87 and 88: 9 FormidlingProjektets resultater o
- Page 89 and 90: I projektet er der endvidere observ
- Page 91 and 92: De samlede udgifter til moniterings
- Page 93 and 94: Pedersen GB, Scheutz C, Pedicone, A
- Page 95 and 96: Figur 1.2. Illustration af FID-scre
- Page 97 and 98: Bilag B1 VejrdataDette bilag indeho
- Page 99 and 100: Atmosfæretryk10251020Tryk / mbar10
- Page 101 and 102: Atmosfæretryk10301025Tryk / mbar10
- Page 103 and 104: Atmosfæretryk10301025Tryk / mbar10
- Page 105 and 106: Bilag C1 Gasprofiler i BiocoverDett
- Page 107 and 108: Gasprofiler - Site 2% v/ v % v/ v06
- Page 109 and 110: Gasprofiler - Site 6% v/ v % v/ v06
- Page 111 and 112: Gasprofiler - Site 10% v/ v % v/ v0
- Page 113 and 114: Bilag D1 Gassammensætning igasford
- Page 115 and 116: % v/ vsektion O 2 N 2 CH 4 CO 2Sekt
- Page 117 and 118: % v/ vSektion O 2 N 2 CH 4 CO 2Sekt
- Page 119 and 120: Gasfordelingslaget - 6. maj 2010Gas
- Page 121 and 122: 5 RenpumpningsforsøgRørSektion 6.
- Page 123 and 124: Bilag E1 FluxmålingerI dette bilag
- Page 125 and 126: 3 Fluxmålinger - gridmålinger ise
- Page 127 and 128: 4 Øvrige fluxmålinger4.1 Måleser
- Page 129: Bilag F1 Totalmålinger, Klintholmd
- Page 133 and 134: Table 2. Summary for the CH 4 measu
- Page 135 and 136: Figur 1. Estimeret gasproduktion fo
- Page 137 and 138: 1998 forudsætninger1.400Totale gas
- Page 139 and 140: Sammenligning af gasproduktion2.500
- Page 141 and 142: Bilag 1Inddeling af etaper på Klin
- Page 143 and 144: Bilag 2Beregninger og graferRef 087
- Page 145 and 146: Graf for den totale gasproduktion p
- Page 147 and 148: Svært omsætteligt affald360Totale
- Page 163 and 164: 1 Estimeret gasproduktion påetape
- Page 165 and 166: Prognose af CH 4 produktionen, etap
- Page 167 and 168: Prognose af CH 4 produktion, etape