7-2018
Fachzeitschrift für Hochfrequenz- und Mikrowellentechnik
Fachzeitschrift für Hochfrequenz- und Mikrowellentechnik

Erfolgreiche ePaper selbst erstellen
Machen Sie aus Ihren PDF Publikationen ein blätterbares Flipbook mit unserer einzigartigen Google optimierten e-Paper Software.
RF & Wireless<br />
This text or elements area can be<br />
used to define the characteristics<br />
of each element. In this case, elements<br />
1, 4, 13, and 16 refer to<br />
an antenna pattern called “Corner.”<br />
The “Edge” elements are<br />
referring to a different antenna<br />
pattern and then the remaining<br />
elements in the center that are<br />
not defined as a number in the<br />
figure are reading in an antenna<br />
pattern called “Center.”<br />
Figure 7: Each link that is connected to an element can be defined<br />
form as described in Figure 4,<br />
but designers can now define<br />
the characteristics of the RF link<br />
that is connected to the patch in<br />
order to gain further insight into<br />
the performance of the array. In<br />
addition, users can have a full<br />
transceiver model for each element<br />
of the array, as opposed<br />
to the previous model that only<br />
allowed control of the gain and<br />
phase of each element.<br />
As shown in Figure 6, the text<br />
file is being used to configure<br />
Phased Array F and enables the<br />
designer to define the array geometry.<br />
This is a text line that is<br />
written in the data file (highlighted<br />
in blue) that indicates<br />
to the software that the array<br />
should be configured as a 4 x 4<br />
array with a distance of half a<br />
lambda between each element.<br />
Additionally, each link has been<br />
defined that is connected to an<br />
element shown in the text highlighted<br />
in blue as “RF A”(Figure<br />
7). This command line indicates<br />
that there is an amplifier with<br />
a gain of 0 and a compression<br />
point of 100 dB (indicated by<br />
blue highlight). This example<br />
is just one of many capabilities<br />
in the VSS file-based phasedarray<br />
model and an illustration<br />
of how to work with this text file<br />
to configure the array.<br />
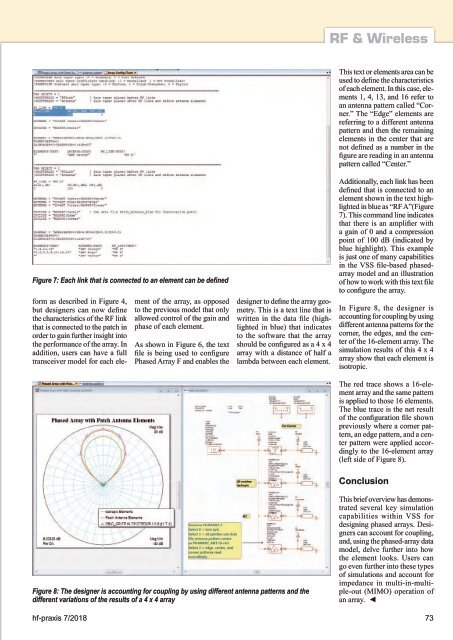
In Figure 8, the designer is<br />
accounting for coupling by using<br />
different antenna patterns for the<br />
corner, the edges, and the center<br />
of the 16-element array. The<br />
simulation results of this 4 x 4<br />
array show that each element is<br />
isotropic.<br />
The red trace shows a 16-element<br />
array and the same pattern<br />
is applied to those 16 elements.<br />
The blue trace is the net result<br />
of the configuration file shown<br />
previously where a corner pattern,<br />
an edge pattern, and a center<br />
pattern were applied accordingly<br />
to the 16-element array<br />
(left side of Figure 8).<br />
Conclusion<br />
Figure 8: The designer is accounting for coupling by using different antenna patterns and the<br />
different variations of the results of a 4 x 4 array<br />
This brief overview has demonstrated<br />
several key simulation<br />
capabilities within VSS for<br />
designing phased arrays. Designers<br />
can account for coupling,<br />
and, using the phased-array data<br />
model, delve further into how<br />
the element looks. Users can<br />
go even further into these types<br />
of simulations and account for<br />
impedance in multi-in-multiple-out<br />
(MIMO) operation of<br />
an array. ◄<br />
hf-praxis 7/<strong>2018</strong> 73