89-91 - Polskie Stowarzyszenie Biomateriałów
89-91 - Polskie Stowarzyszenie Biomateriałów
89-91 - Polskie Stowarzyszenie Biomateriałów

Create successful ePaper yourself
Turn your PDF publications into a flip-book with our unique Google optimized e-Paper software.
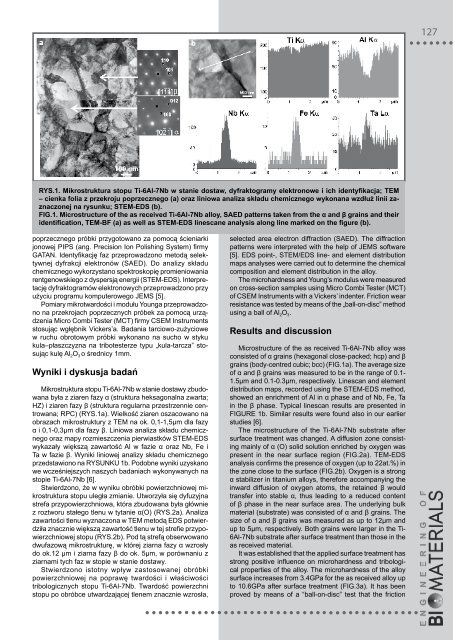
ys.1. mikrostruktura stopu ti-6al-7nb w stanie dostaw, dyfraktogramy elektronowe i ich identyfikacja; tem<br />
– cienka folia z przekroju poprzecznego (a) oraz liniowa analiza składu chemicznego wykonana wzdłuż linii zaznaczonej<br />
na rysunku; stem-eds (b).<br />
FIg.1. microstructure of the as received ti-6al-7nb alloy, saed patterns taken from the α and β grains and their<br />
identification, tem-BF (a) as well as stem-eds linescane analysis along line marked on the figure (b).<br />
poprzecznego próbki przygotowano za pomocą ścieniarki<br />
jonowej PIPS (ang. Precision Ion Polishing System) firmy<br />
GATAN. Identyfikację faz przeprowadzono metodą selektywnej<br />
dyfrakcji elektronów (SAED). Do analizy składu<br />
chemicznego wykorzystano spektroskopię promieniowania<br />
rentgenowskiego z dyspersją energii (STEM-EDS). Interpretację<br />
dyfraktogramów elektronowych przeprowadzono przy<br />
użyciu programu komputerowego JEMS [5].<br />
Pomiary mikrotwardości i modułu Younga przeprowadzono<br />
na przekrojach poprzecznych próbek za pomocą urządzenia<br />
Micro Combi Tester (MCT) firmy CSEM Instruments<br />
stosując wgłębnik Vickers’a. Badania tarciowo-zużyciowe<br />
w ruchu obrotowym próbki wykonano na sucho w styku<br />
kula–płaszczyzna na tribotesterze typu „kula-tarcza” stosując<br />
kulę Al 2o 3 o średnicy 1mm.<br />
wyniki i dyskusja badań<br />
Mikrostruktura stopu Ti-6Al-7Nb w stanie dostawy zbudowana<br />
była z ziaren fazy α (struktura heksagonalna zwarta;<br />
HZ) i ziaren fazy β (struktura regularna przestrzennie centrowana;<br />
rPC) (rYS.1a). Wielkość ziaren oszacowano na<br />
obrazach mikrostruktury z TEM na ok. 0,1-1,5µm dla fazy<br />
α i 0,1-0,3µm dla fazy β. Liniowa analiza składu chemicznego<br />
oraz mapy rozmieszczenia pierwiastków STEM-EDS<br />
wykazały większą zawartość Al w fazie α oraz Nb, Fe i<br />
Ta w fazie β. Wyniki liniowej analizy składu chemicznego<br />
przedstawiono na rYSuNKu 1b. Podobne wyniki uzyskano<br />
we wcześniejszych naszych badaniach wykonywanych na<br />
stopie Ti-6Al-7Nb [6].<br />
Stwierdzono, że w wyniku obróbki powierzchniowej mikrostruktura<br />
stopu uległa zmianie. utworzyła się dyfuzyjna<br />
strefa przypowierzchniowa, która zbudowana była głównie<br />
z roztworu stałego tlenu w tytanie α(O) (rYS.2a). Analiza<br />
zawartości tlenu wyznaczona w TEM metodą EDS potwierdziła<br />
znacznie większą zawartość tlenu w tej strefie przypowierzchniowej<br />
stopu (rYS.2b). Pod tą strefą obserwowano<br />
dwufazową mikrostrukturę, w której ziarna fazy α wzrosły<br />
do ok.12 μm i ziarna fazy β do ok. 5μm, w porównaniu z<br />
ziarnami tych faz w stopie w stanie dostawy.<br />
Stwierdzono istotny wpływ zastosowanej obróbki<br />
powierzchniowej na poprawę twardości i właściwości<br />
tribologicznych stopu Ti-6Al-7Nb. Twardość powierzchni<br />
stopu po obróbce utwardzającej tlenem znacznie wzrosła,<br />
selected area electron diffraction (SAED). The diffraction<br />
patterns were interpreted with the help of JEMS software<br />
[5]. EDS point-, STEM/EDS line- and element distribution<br />
maps analyses were carried out to determine the chemical<br />
composition and element distribution in the alloy.<br />
The microhardness and Young’s modulus were measured<br />
on cross-section samples using Micro Combi Tester (MCT)<br />
of CSEM Instruments with a Vickers’ indenter. Friction wear<br />
resistance was tested by means of the „ball-on-disc” method<br />
using a ball of Al 2o 3.<br />
results and discussion<br />
Microstructure of the as received Ti-6Al-7Nb alloy was<br />
consisted of α grains (hexagonal close-packed; hcp) and β<br />
grains (body-centred cubic; bcc) (FIG.1a). The average size<br />
of α and β grains was measured to be in the range of 0.1-<br />
1.5µm and 0.1-0.3µm, respectively. Linescan and element<br />
distribution maps, recorded using the STEM-EDS method,<br />
showed an enrichment of Al in α phase and of Nb, Fe, Ta<br />
in the β phase. Typical linescan results are presented in<br />
FIGurE 1b. Similar results were found also in our earlier<br />
studies [6].<br />
The microstructure of the Ti-6Al-7Nb substrate after<br />
surface treatment was changed. A diffusion zone consisting<br />
mainly of α (O) solid solution enriched by oxygen was<br />
present in the near surface region (FIG.2a). TEM-EDS<br />
analysis confirms the presence of oxygen (up to 22at.%) in<br />
the zone close to the surface (FIG.2b). Oxygen is a strong<br />
α stabilizer in titanium alloys, therefore accompanying the<br />
inward diffusion of oxygen atoms, the retained β would<br />
transfer into stable α, thus leading to a reduced content<br />
of β phase in the near surface area. The underlying bulk<br />
material (substrate) was consisted of α and β grains. The<br />
size of α and β grains was measured as up to 12μm and<br />
up to 5μm, respectively. Both grains were larger in the Ti-<br />
6Al-7Nb substrate after surface treatment than those in the<br />
as received material.<br />
It was established that the applied surface treatment has<br />
strong positive influence on microhardness and tribological<br />
properties of the alloy. The microhardness of the alloy<br />
surface increases from 3.4GPa for the as received alloy up<br />
to 10.6GPa after surface treatment (FIG.3a). It has been<br />
proved by means of a “ball-on-disc” test that the friction<br />
127