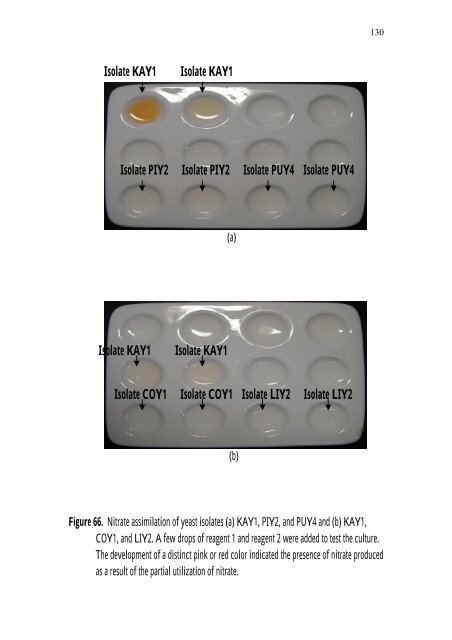
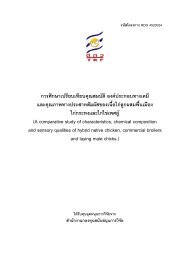
Isolate KAY1 Isolate KAY1 Isolate PIY2 Isolate PIY2 Isolate PUY4 Isolate PUY4 Isolate KAY1 Isolate KAY1 (a) Isolate COY1 Isolate COY1 Isolate LIY2 Isolate LIY2 (b) ��� Figure 66. Nitrate assimilation of yeast isolates (a) KAY1, PIY2, and PUY4 and (b) KAY1, COY1, and LIY2. A few drops of reagent 1 and reagent 2 were added to test the culture. The development of a distinct pink or red color indicated the presence of nitrate produced as a result of the partial utilization of nitrate.
��� assimilations were observed for D-glucose, D-galactose, sucrose, trehalose, cellobiose, and raffinose. Weakly or negative assimilations were detected with D-xylose and maltose. Negative assimilations were D-ribose, L-arabinose, L-rhamnose, salicin, melibiose, lactose, melezitose, starch, D-mannitol, and D-gluconate. Isolate LIY2, D-glucose was fermented and maltose was very weakly fermented. Positive assimilations was D-glucose and weak assimilations were detected with D-galactose, D-ribose, L-arabinose and cellobiose. Negative assimilations were observed for D-xylose, L-rhamnose, sucrose, maltose, trehalose, salicin, melibiose, lactose, raffinose, melezitose, D-mannitol and D-gluconate. Isolate COY1, positive and weakly fermentations were observed for D-glucose. Assimilations of D-glucose, D-xylose, sucrose, maltose, salicin, melezitose, and D-mannitol were positive. Weak assimilations were detected with D-ribose, and L-rhamnose. D-galactose, L-arabinose, trehalose, cellobiose, melibiose, raffinose, starch, and D-gluconate were negative assimilation. Isolate FAY2 showed D-glucose was weakly fermented. Weakly or negative fermentations were maltose and sucrose. Fermentations of D-galactose, trehalose, melibiose, lactose, cellobiose, raffinose, and D-xylose were negative. The following carbon compounds were assimilated: D-glucose, D-ribose, D-xylose, and trehalose. Sucrose and salicin were weakly or negative assimilated. Negative assimilations were observed for D-galactose, L-arabinose, L-rhamnose, maltose, cellobiose, melibiose, lactose, raffinose, melezitose, starch, D-mannitol, and D-gluconate. There appear to be no exceptions to the rule that when a yeast strain ferments a carbohydrate it was also able to grow on it. However, the reverse does not hold true: many yeast grow aerobically on sugars they could not fermented. It was essential that only pure, high-grade carbohydrates were used in the preparation of the media used in these tests (Kurtzman et al., 1998). Yeasts vary in their ability to fermented sugars as measured by the production of carbon dioxide. Yeasts of the genera Kluyveromyces, Saccharomyces, and Zygosaccharomyces for example, ferment, at least, glucose vigorously, whereas others, such as Rhodosporidium and Sterigmatomyces, did not noticeably ferment any sugars. Species ranging from non-fermentative to strongly fermentative were found in other genera.
- Page 1 and 2:
PRODUCTION OF NUTRIENT SOURCES FOR
- Page 3 and 4:
PRODUCTION OF NUTRIENT SOURCES FOR
- Page 5 and 6:
CHARDCHAI BUROM : PRODUCTION OF NUT
- Page 7 and 8:
CONTENTS Page ABSTRACT (THAI)……
- Page 9 and 10:
3.6.1� Determination of the suita
- Page 11 and 12:
���� 17� Glycerol concent
- Page 13 and 14:
40� Time courses of mannitol prod
- Page 15 and 16:
59� Effects of various heat shock
- Page 17 and 18:
LIST OF TABLES Table Page ���
- Page 19 and 20:
LIST OF ABBREVIATIONS Aw water avai
- Page 21 and 22:
CHAPTER I INTRODUCTION For mass cul
- Page 23 and 24:
available (Burton, 1965). The molec
- Page 25 and 26:
1.1.1� Carbon metabolism in Rhizo
- Page 27 and 28:
strains unable to use the carbon so
- Page 29 and 30:
Figure 2. The fructose bisphosphate
- Page 31 and 32:
1.2�Classification of yeasts Mank
- Page 33 and 34:
Table 3. (continued). Class Order F
- Page 35 and 36:
Ustilaginales (Oberwinkler, 1987).
- Page 37 and 38:
f Cystofilobasidium has thick-walle
- Page 39 and 40:
Table 5. (continued). Sugar alcohol
- Page 41 and 42:
specific cases, but Brown (1978) pr
- Page 43 and 44:
KY 6166 was also studied using larg
- Page 45 and 46:
Figure 5. Important pathways of gly
- Page 47 and 48:
may be present in different ratios.
- Page 49 and 50:
amylase systems of the yeast specie
- Page 51 and 52:
Table 7. (continued). EC Recommende
- Page 53 and 54:
Table 8. (continued). Species a D.p
- Page 55 and 56:
Table 9. (continued). Cell product
- Page 57 and 58:
2.1.3 Equipment and other materials
- Page 59 and 60:
Spotted either the supernatant of c
- Page 61 and 62:
amylase action, the actual reaction
- Page 63 and 64:
A) Determination of the suitable an
- Page 65 and 66:
B) Salt-stress conditions Fifty mil
- Page 67 and 68:
2.2.8 Cultivation of Bradyrhizobium
- Page 69 and 70:
The cultured medium of yeast. Quant
- Page 71 and 72:
intervals for accumulation of gas i
- Page 73 and 74:
CHAPTER III RESULTS AND DISCUSSION
- Page 75 and 76:
Glycerol Xylitol Glucose Mannitol S
- Page 77 and 78:
Glycerol Xylitol Glucose Mannitol S
- Page 79 and 80:
Table 10. Primary screening of glyc
- Page 81 and 82:
Table 10. (continued). No. Isolate
- Page 83 and 84:
Glycerol in cell lysate (g/l) A Gly
- Page 85 and 86:
average were 4-10 g of glycerol per
- Page 87 and 88:
were isolated from fresh fruits, Ma
- Page 89 and 90:
�third day of incubation (Figure
- Page 91 and 92:
Reducing sugars (g/l) Reducing suga
- Page 93 and 94:
These results indicated that the co
- Page 95 and 96:
3.6.1 Determination of the suitable
- Page 97 and 98:
g/l 1.8 1.6 1.4 1.2 1.0 0.8 0.6 0.4
- Page 99 and 100: Reducing sugars (g/l) 8 6 4 2 0 0 1
- Page 101 and 102: Reducing sugars (g/l) 4.0 3.5 3.0 2
- Page 103 and 104: g/l 1.4 1.2 1.0 0.8 0.6 0.4 0.2 0.0
- Page 105 and 106: g/l g/l g/l 1.5 1.0 0.5 0.0 1.2 1.0
- Page 107 and 108: Starch fermentation was conducted i
- Page 109 and 110: g/l g/l 7 6 5 4 3 2 1 0 8 6 4 2 0 0
- Page 111 and 112: g/l g/l 8 6 4 2 0 8 6 4 2 0 1 2 3 4
- Page 113 and 114: g/l g/l 8 6 4 2 0 8 6 4 2 0 0 1 1 2
- Page 115 and 116: g/l g/l 1.6 1.4 1.2 1.0 0.8 0.6 0.4
- Page 117 and 118: g/l g/l 1.6 1.4 1.2 1.0 0.8 0.6 0.4
- Page 119 and 120: The results showed that amounts var
- Page 121 and 122: g/l g/l 4.0 3.5 3.0 2.5 2.0 1.5 1.0
- Page 123 and 124: ��� fermentation, but the inc
- Page 125 and 126: g/l g/l 2.0 1.6 1.2 0.8 0.4 0.0 3.2
- Page 127 and 128: g/l g/l 1.2 1.0 0.8 0.6 0.4 0.2 0.0
- Page 129 and 130: ��� intracellularly a decreas
- Page 131 and 132: g/l g/l 5.0 4.0 3.0 2.0 1.0 0.0 2.5
- Page 133 and 134: g/l g/l 2 1.8 1.6 1.4 1.2 1 0.8 0.6
- Page 135 and 136: g/L 7 6 5 4 3 2 1 0 1 2 3 4 5 6 7 0
- Page 137 and 138: g/l 8 7 6 5 4 3 2 1 0 1 2 3 4 5 6 7
- Page 139 and 140: ��� effected by heat shock po
- Page 141 and 142: Table 15. The comparison of media f
- Page 143 and 144: Table 17. Growth of Bradyrhizobium
- Page 145 and 146: ��� Rhizobium (Stowers, 1985;
- Page 147 and 148: ��� 3.9 Identification of yea
- Page 149: KAY1 PIY2 PUY4 Y69 LIY2 COY1 FAY2 C
- Page 153 and 154: Table 20. (continued). Yeast strain
- Page 155 and 156: Table 20. (continued). 15. Pichia k
- Page 157 and 158: ��� 3.9.5 Ascospore formation
- Page 159 and 160: (a) (b) (c ) (d) (e) ��� Figu
- Page 161 and 162: (a) (b) (c) (d) (e) (f) ��� F
- Page 163 and 164: (c) (a) ��� Figure 72. Cell m
- Page 165 and 166: ��� Metshnikowia (Pitt and Mi
- Page 167 and 168: CHAPTER IV CONCLUSION This study ex
- Page 169 and 170: only a low capital investment. Ther
- Page 171 and 172: ��� Barnett, J. A., Payne, R.
- Page 173 and 174: ��� De Mot, R., and Verachter
- Page 175 and 176: ��� Jennings, D. H. (1995). T
- Page 177 and 178: ��� Lie, T. A., Muilenbury M.
- Page 179 and 180: ��� Onishi, H., and Suzuki, T
- Page 181 and 182: ��� Sinclair, N. A., and Stok
- Page 183 and 184: ��� Van Rossum, D., Schuurman
- Page 185 and 186: ��� Young, J. P. W., and Hauk
- Page 187 and 188: Acetone Methanol Solvent for mobile
- Page 189 and 190: � 300 µg/ml, 200 µg/ml, and 100
- Page 191 and 192: Soluble Starch 20.0 g Distilled wat
- Page 193 and 194: 13.�Nitrate broth KNO 3 1.0 g Glu
- Page 195 and 196: If the sample had been diluted befo
- Page 197 and 198: Table 1D. (continued). Source of ye
- Page 199 and 200: Table 1D. (continued). Source of ye
- Page 201 and 202:
Table 1D. (continued). Source of ye
- Page 203 and 204:
Table 1D. (continued). Source of ye
- Page 205 and 206:
Table 1D. (continued). Source of ye
- Page 207 and 208:
Table 1D. (continued). Source of ye
- Page 209 and 210:
Table 1D. (continued). Source of ye
- Page 212 and 213:
E. Additional figures Abs 540 nm (a
- Page 214 and 215:
Abs 580 nm 1.4 1.2 1 0.8 0.6 0.4 0.
- Page 216 and 217:
Figure 7E. Calibration curves for H
- Page 218 and 219:
Figure 9E. Example of HPLC chromato
- Page 220:
Cell/mL 1.0E+09 8.0E+08 6.0E+08 4.0