Tesco plc Annual Report and Financial Statements 2008
Tesco plc Annual Report and Financial Statements 2008
Tesco plc Annual Report and Financial Statements 2008

Create successful ePaper yourself
Turn your PDF publications into a flip-book with our unique Google optimized e-Paper software.
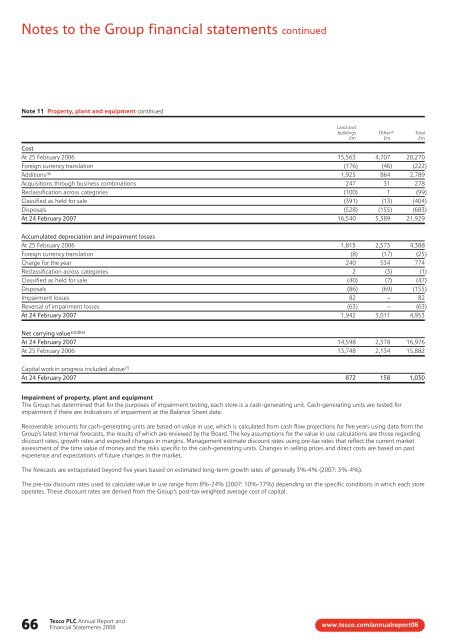
Notes to the Group financial statements continued<br />
Note 11 Property, plant <strong>and</strong> equipment continued<br />
66<br />
<strong>Tesco</strong> PLC <strong>Annual</strong> <strong>Report</strong> <strong>and</strong><br />
<strong>Financial</strong> <strong>Statements</strong> <strong>2008</strong><br />
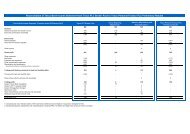
L<strong>and</strong> <strong>and</strong><br />
buildings Other (a) Total<br />
£m £m £m<br />
Cost<br />
At 25 February 2006 15,563 4,707 20,270<br />
Foreign currency translation (176) (46) (222)<br />
Additions (b) 1,925 864 2,789<br />
Acquisitions through business combinations 247 31 278<br />
Reclassification across categories (100) 1 (99)<br />
Classified as held for sale (391) (13) (404)<br />
Disposals (528) (155) (683)<br />
At 24 February 2007 16,540 5,389 21,929<br />
Accumulated depreciation <strong>and</strong> impairment losses<br />
At 25 February 2006 1,815 2,573 4,388<br />
Foreign currency translation (8) (17) (25)<br />
Charge for the year 240 534 774<br />
Reclassification across categories 2 (3) (1)<br />
Classified as held for sale (40) (7) (47)<br />
Disposals (86) (69) (155)<br />
Impairment losses 82 – 82<br />
Reversal of impairment losses (63) – (63)<br />
At 24 February 2007 1,942 3,011 4,953<br />
Net carrying value (c)(d)(e)<br />
At 24 February 2007 14,598 2,378 16,976<br />
At 25 February 2006 13,748 2,134 15,882<br />
Capital work in progress included above (f)<br />
At 24 February 2007 872 158 1,030<br />
Impairment of property, plant <strong>and</strong> equipment<br />
The Group has determined that for the purposes of impairment testing, each store is a cash-generating unit. Cash-generating units are tested for<br />
impairment if there are indications of impairment at the Balance Sheet date.<br />
Recoverable amounts for cash-generating units are based on value in use, which is calculated from cash flow projections for five years using data from the<br />
Group’s latest internal forecasts, the results of which are reviewed by the Board. The key assumptions for the value in use calculations are those regarding<br />
discount rates, growth rates <strong>and</strong> expected changes in margins. Management estimate discount rates using pre-tax rates that reflect the current market<br />
assessment of the time value of money <strong>and</strong> the risks specific to the cash-generating units. Changes in selling prices <strong>and</strong> direct costs are based on past<br />
experience <strong>and</strong> expectations of future changes in the market.<br />
The forecasts are extrapolated beyond five years based on estimated long-term growth rates of generally 3%-4% (2007: 3%-4%).<br />
The pre-tax discount rates used to calculate value in use range from 8%-24% (2007: 10%-17%) depending on the specific conditions in which each store<br />
operates. These discount rates are derived from the Group’s post-tax weighted average cost of capital.<br />
www.tesco.com/annualreport08