Tesco plc Annual Report and Financial Statements 2008
Tesco plc Annual Report and Financial Statements 2008
Tesco plc Annual Report and Financial Statements 2008

Create successful ePaper yourself
Turn your PDF publications into a flip-book with our unique Google optimized e-Paper software.
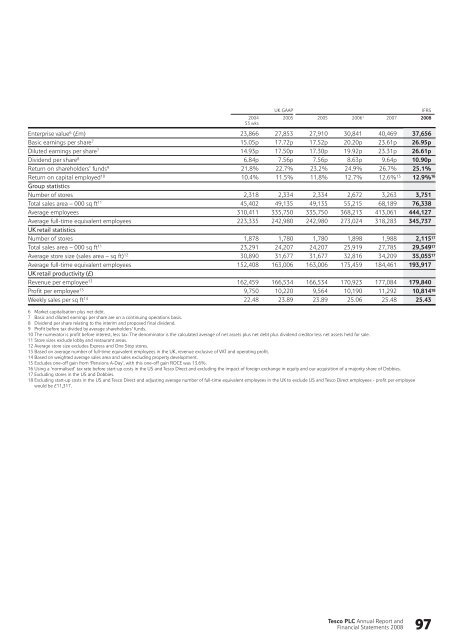
UK GAAP IFRS<br />
2004 2005 2005 20061 53 wks<br />
2007 <strong>2008</strong><br />
Enterprise value6 (£m) 23,866 27,853 27,910 30,841 40,469 37,656<br />
Basic earnings per share7 15.05p 17.72p 17.52p 20.20p 23.61p 26.95p<br />
Diluted earnings per share7 14.93p 17.50p 17.30p 19.92p 23.31p 26.61p<br />
Dividend per share8 6.84p 7.56p 7.56p 8.63p 9.64p 10.90p<br />
Return on shareholders’ funds9 21.8% 22.7% 23.2% 24.9% 26.7% 25.1%<br />
Return on capital employed10 10.4% 11.5% 11.8% 12.7% 12.6% 15 12.9% 16<br />
Group statistics<br />
Number of stores 2,318 2,334 2,334 2,672 3,263 3,751<br />
Total sales area – 000 sq ft11 45,402 49,135 49,135 55,215 68,189 76,338<br />
Average employees 310,411 335,750 335,750 368,213 413,061 444,127<br />
Average full-time equivalent employees<br />
UK retail statistics<br />
223,335 242,980 242,980 273,024 318,283 345,737<br />
Number of stores 1,878 1,780 1,780 1,898 1,988 2,115<br />
Total sales area – 000 sq ft11 23,291 24,207 24,207 25,919 27,785 29,549<br />
Average store size (sales area – sq ft) 12 30,890 31,677 31,677 32,816 34,209 35,055<br />
Average full-time equivalent employees<br />
UK retail productivity (£)<br />
152,408 163,006 163,006 175,459 184,461 193,917<br />
Revenue per employee13 162,459 166,534 166,534 170,923 177,084 179,840<br />
Profit per employee13 9,750 10,220 9,564 10,190 11,292 10,814<br />
Weekly sales per sq ft14 17<br />
17<br />
17<br />
18<br />
22.48 23.89 23.89 25.06 25.48 25.43<br />
6 Market capitalisation plus net debt.<br />
7 Basic <strong>and</strong> diluted earnings per share are on a continuing operations basis.<br />
8 Dividend per share relating to the interim <strong>and</strong> proposed final dividend.<br />
9 Profit before tax divided by average shareholders’ funds.<br />
10 The numerator is profit before interest, less tax. The denominator is the calculated average of net assets plus net debt plus dividend creditor less net assets held for sale.<br />
11 Store sizes exclude lobby <strong>and</strong> restaurant areas.<br />
12 Average store size excludes Express <strong>and</strong> One Stop stores.<br />
13 Based on average number of full-time equivalent employees in the UK, revenue exclusive of VAT <strong>and</strong> operating profit.<br />
14 Based on weighted average sales area <strong>and</strong> sales excluding property development.<br />
15 Excludes one-off gain from ‘Pensions A-Day’, with this one-off gain ROCE was 13.6%.<br />
16 Using a ‘normalised’ tax rate before start-up costs in the US <strong>and</strong> <strong>Tesco</strong> Direct <strong>and</strong> excluding the impact of foreign exchange in equity <strong>and</strong> our acquisition of a majority share of Dobbies.<br />
17 Excluding stores in the US <strong>and</strong> Dobbies.<br />
18 Excluding start-up costs in the US <strong>and</strong> <strong>Tesco</strong> Direct <strong>and</strong> adjusting average number of full-time equivalent employees in the UK to exclude US <strong>and</strong> <strong>Tesco</strong> Direct employees - profit per employee<br />
would be £11,317.<br />
<strong>Tesco</strong> PLC <strong>Annual</strong> <strong>Report</strong> <strong>and</strong><br />
<strong>Financial</strong> <strong>Statements</strong> <strong>2008</strong> 97