Xcell Journal Issue 78: Charge to Market with Xilinx 7 Series ...
Xcell Journal Issue 78: Charge to Market with Xilinx 7 Series ...
Xcell Journal Issue 78: Charge to Market with Xilinx 7 Series ...

You also want an ePaper? Increase the reach of your titles
YUMPU automatically turns print PDFs into web optimized ePapers that Google loves.
ASK FAE-X<br />
How <strong>to</strong> Build<br />
a Self-Checking<br />
Testbench<br />
Testbenches, especially<br />
those you will use often<br />
or for a number of similar<br />
projects, should be selfchecking<br />
and time-agnostic.<br />
Here are some tips on the<br />
best way <strong>to</strong> construct them.<br />
by William Kafig<br />
Senior Content Development Engineer<br />
<strong>Xilinx</strong>, Inc.<br />
bill.kafig@xilinx.com<br />
A<br />
testbench, as it’s known in<br />
VHDL, or a test fixture in<br />
Verilog, is a construct that<br />
exists in a simulation environment<br />
such as ISim, ModelSim or NCsim.<br />
Simulation enables a unit under test<br />
(UUT)—typically, your synthesizable<br />
FPGA design—<strong>to</strong> connect <strong>to</strong> virtual<br />
(simulated) components such as memory,<br />
communication devices and/or<br />
CPUs, and be driven <strong>with</strong> a known set<br />
of stimuli. These stimuli cause the<br />
UUT <strong>to</strong> react and interact <strong>with</strong> the virtual<br />
components. You can view both<br />
the stimulus and the reaction as waveforms<br />
in the simulation environment.<br />
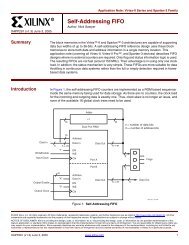
Here’s quick example <strong>to</strong> illustrate<br />
how <strong>to</strong> implement a testbench using a<br />
simple 8-bit up/down <strong>with</strong> reset as the<br />
FPGA design (UUT). The testbench<br />
provides clock, up/down, enable and<br />
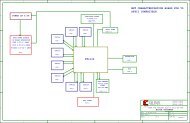
reset control signals. Figure 1 shows<br />
how <strong>to</strong> connect the UUT (central gray<br />
box) <strong>to</strong> a testbench.<br />
The various functions on the left<br />
side of the diagram provide stimulus<br />
for the UUT which, in turn, produces a<br />
series of waveforms displayed in the<br />
simulation environment. Figure 2<br />
shows a quick screen shot of the waveform<br />
view, both zoomed in and zoomed<br />
out. How clearly do you see the results?<br />
Do you see the values ascending, then<br />
descending on the count_out_pins?<br />
What if we zoom in (blown-up circle)?<br />
52 <strong>Xcell</strong> <strong>Journal</strong> First Quarter 2012